The Engineering Tax · Article 19 of 29
What Started as an Extraction Plan Became a Permanent Trap
A team extracted a billing module from a monolith six months ago. They are still running both systems, and the sync layer between them is consuming more budget than either platform. The next article gives you the formula to see exactly why that parallel state costs three times what the estimates predicted, and the one leadership decision that turns a permanent trap into a finished project.
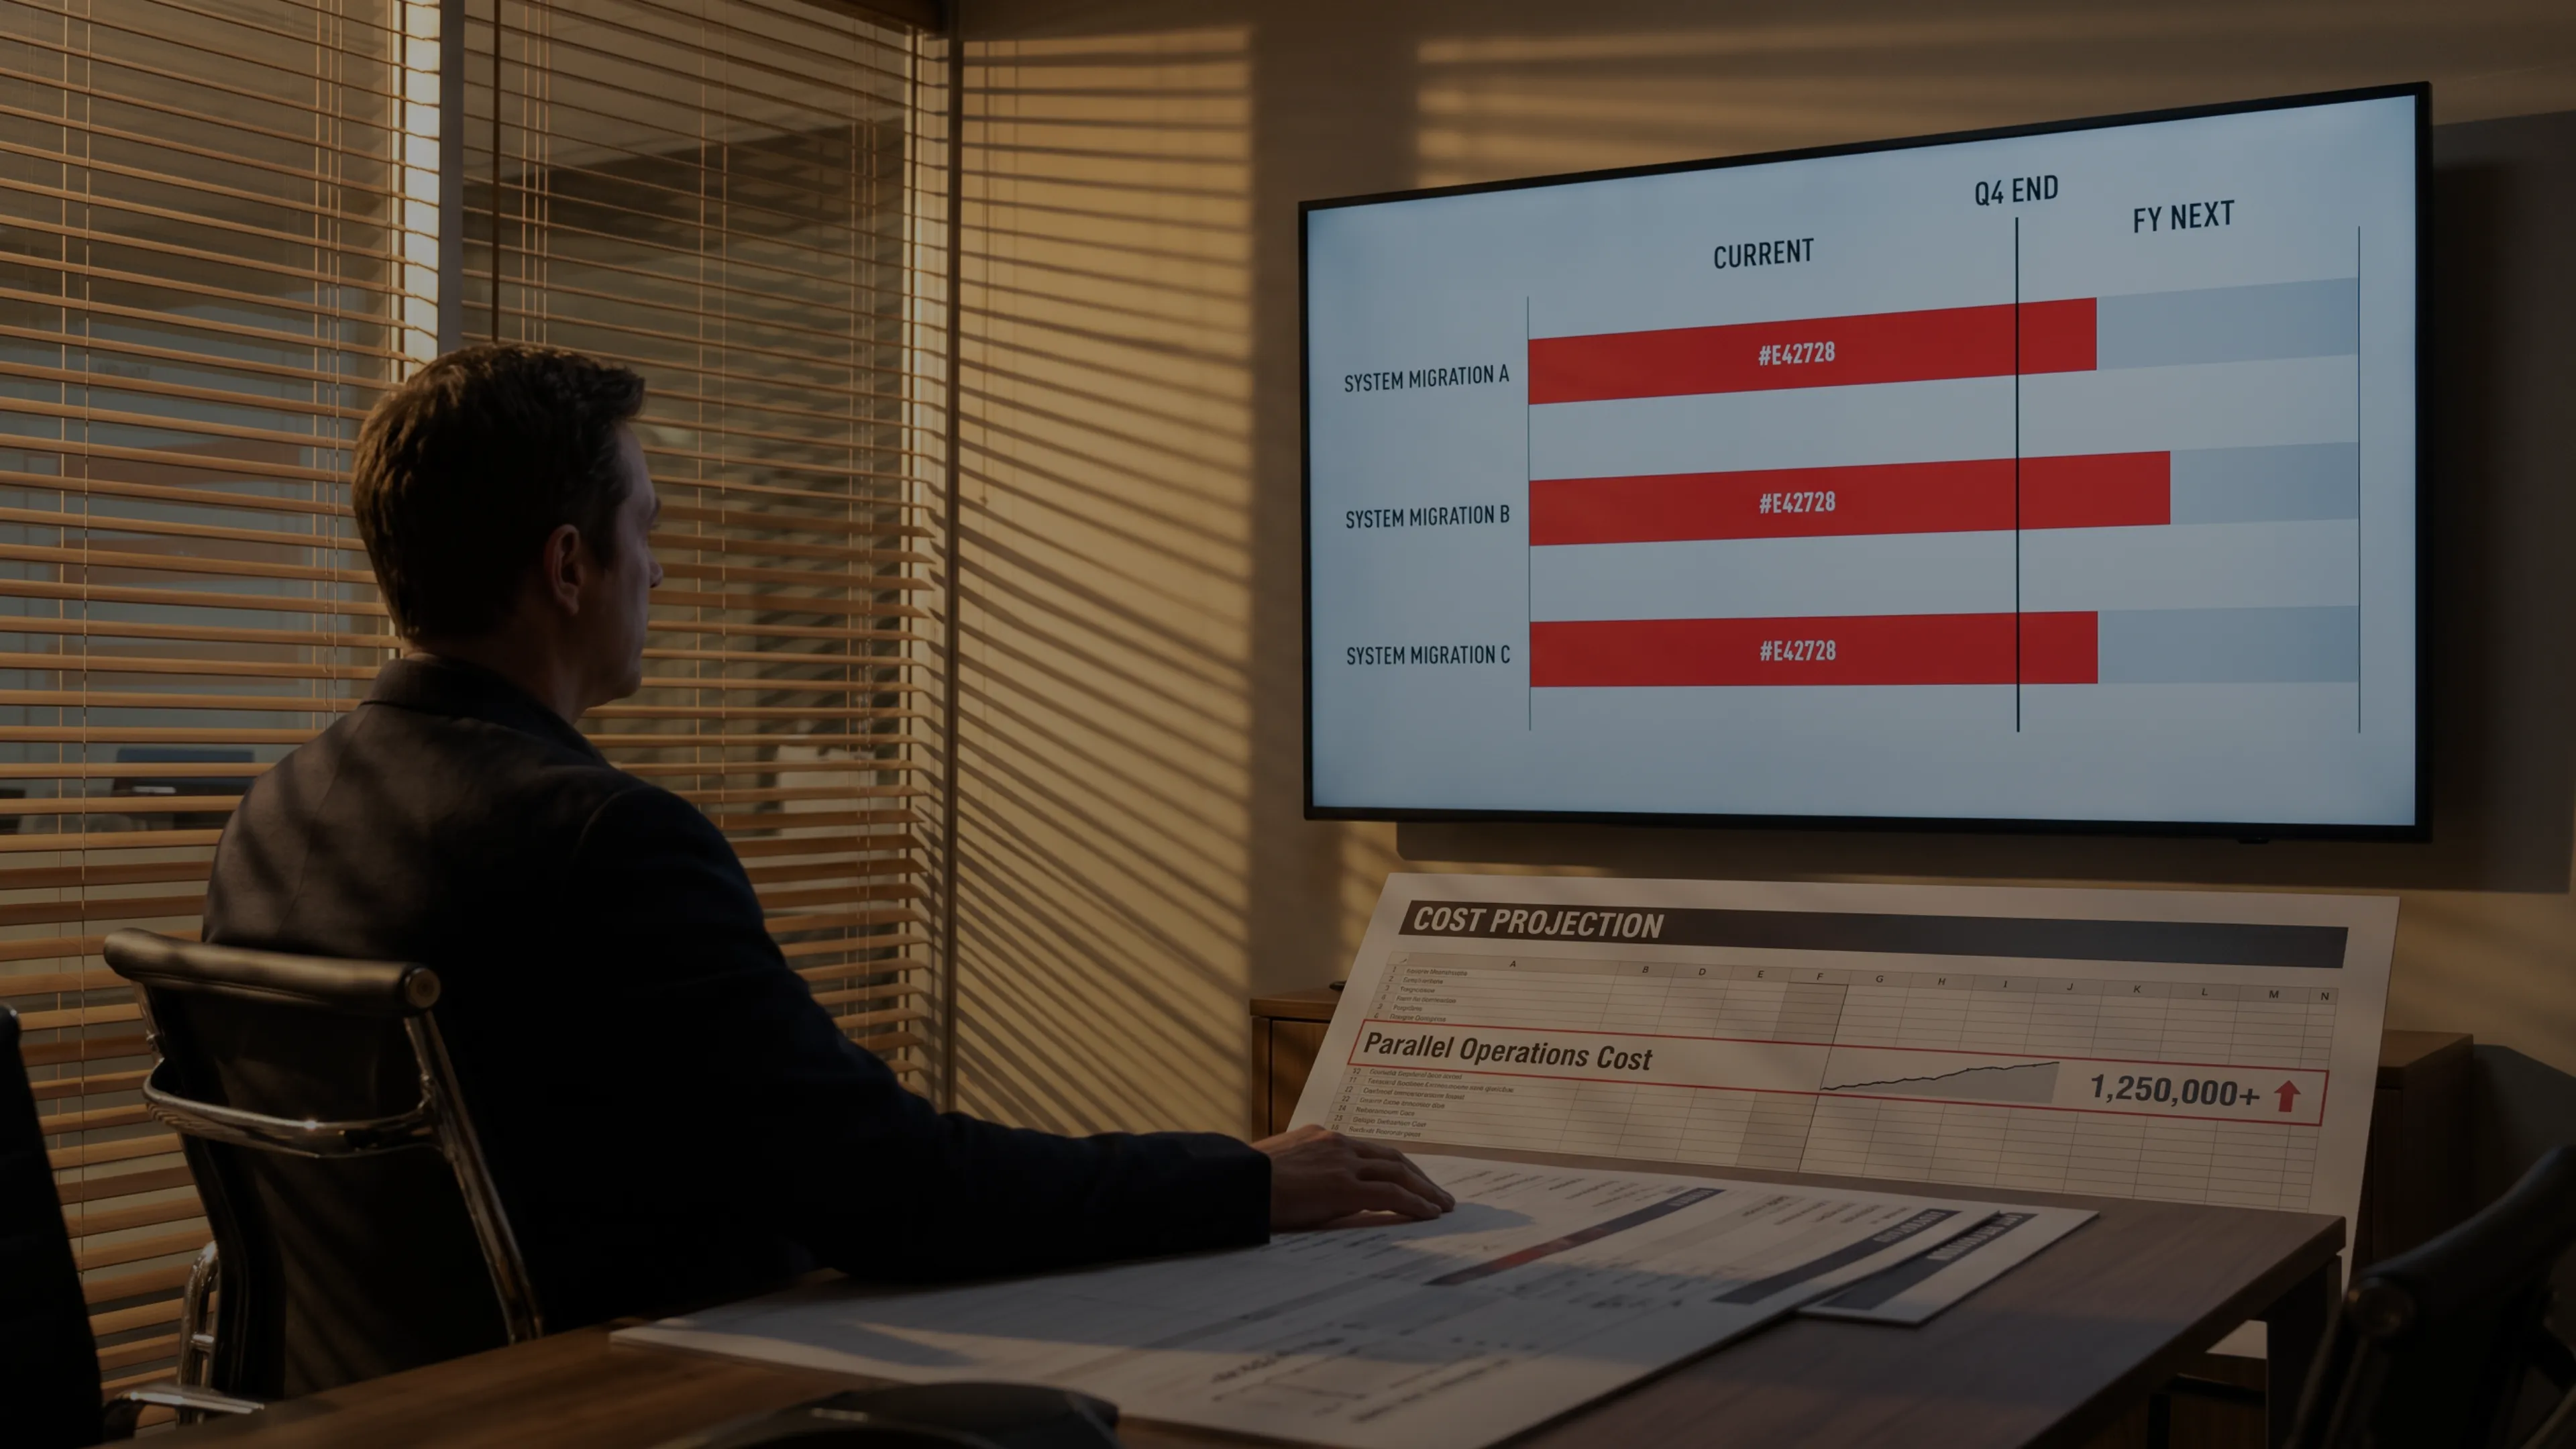
The Cost of Running Parallel Systems When Leadership Lacks Commitment
1. How Extractions Become Permanent
A company decided to extract a billing module from a monolith. Engineers gave their estimate, leadership approved the budget, and years later the old monolith was still running. A new service appeared yet both platforms remained in production, syncing data through a brittle transformation layer that broke constantly. Engineers spent most of their time maintaining this integration layer instead of building features, and leadership wondered why engineering velocity collapsed.
The companies that end up here share a pattern. They raised money before their business model was truly demand-driven. That funding let them build features they wanted instead of features customers needed. Over a year or two, the codebase grew more complex because easy financing detached the company from reality. By the time anyone noticed the architecture was too tangled to change incrementally, the only way out was to extract a piece and rebuild it alongside the old one. What started as a plan became a trap.
One quick fix that creates a sync point is manageable. Ten quick fixes create a system where every new feature requires touching ten different systems. Each shortcut compounds with the previous ones, and the architecture that was supposed to be transitional becomes the only architecture anyone remembers. The political class that benefits from the complexity never has the incentive to remove it, because their relevance depends on the coordination overhead they manage.
This is the default outcome when companies apply the strangler fig pattern without understanding its economics. Research on 186 enterprise modernization projects found that 67% failed to meet stated objectives, and 19% were abandoned mid-project after discovering insurmountable technical barriers. A separate survey of 250 IT professionals put the failure rate at 79%. The median timeline for strangler implementations is 16.2 months, with median costs between $1.8M and $3.4M depending on the strategy. For manual approaches, the failure rate hits 70% due to budget overruns alone.
As a transition strategy, the strangler fig pattern works like this: build the new system alongside the old one, route traffic incrementally, then kill the old one. The approach itself is sound. Leadership fails because they won’t treat the extraction as a finite project with a hard deadline and a change freeze.
2. Three Systems for One Customer
Running two systems in parallel means you’re paying for three, because when a company keeps both old and new systems running simultaneously, it’s actually maintaining three implementations:
- The old system, frozen but still serving production traffic.
- The new system, evolving with product changes.
- The sync/transform layer, bridging two divergent data models and logic sets.
This triplication becomes pure malinvestment if the old system and the sync are never killed. The customer demand that pays for the product never pays for three implementations. Customer demand pays for exactly one working billing module, and anything extra is pure waste that erodes profitability.
The sync layer between old and new systems is where the cost explodes. If the old system stores “order total” as a single field and the new system decomposes it into “subtotal plus tax plus shipping,” the bridge can’t just copy data; it must transform it. Every product change that touches the new system’s data model forces an update to the integration layer. But the old platform stays frozen, so the bridge must also preserve backward compatibility. The gap widens as the transform logic grows and the maintenance burden compounds.
This is why magnitude of change matters more than frequency. One semantic decomposition, like splitting “order total” into three fields with calculation rules, forces the sync layer to implement business logic that didn’t exist before. Adding three new entities that the old system knows nothing about is simpler, because engineers handle them with defaults or null mappings. The first case creates more ongoing sync complexity than the second, even though the second touches more fields.
A signal that this overhead is building shows up in delivery speed. When the time it takes to ship a feature becomes disproportionate to the value that feature creates, the platform is telling leadership that interdependence has passed its expiration date. The problem is that delivery time rarely gets measured against feature value. Vanity metrics like user growth or funding rounds dominate the scorecard instead.
3. Modeling the Extraction Cost
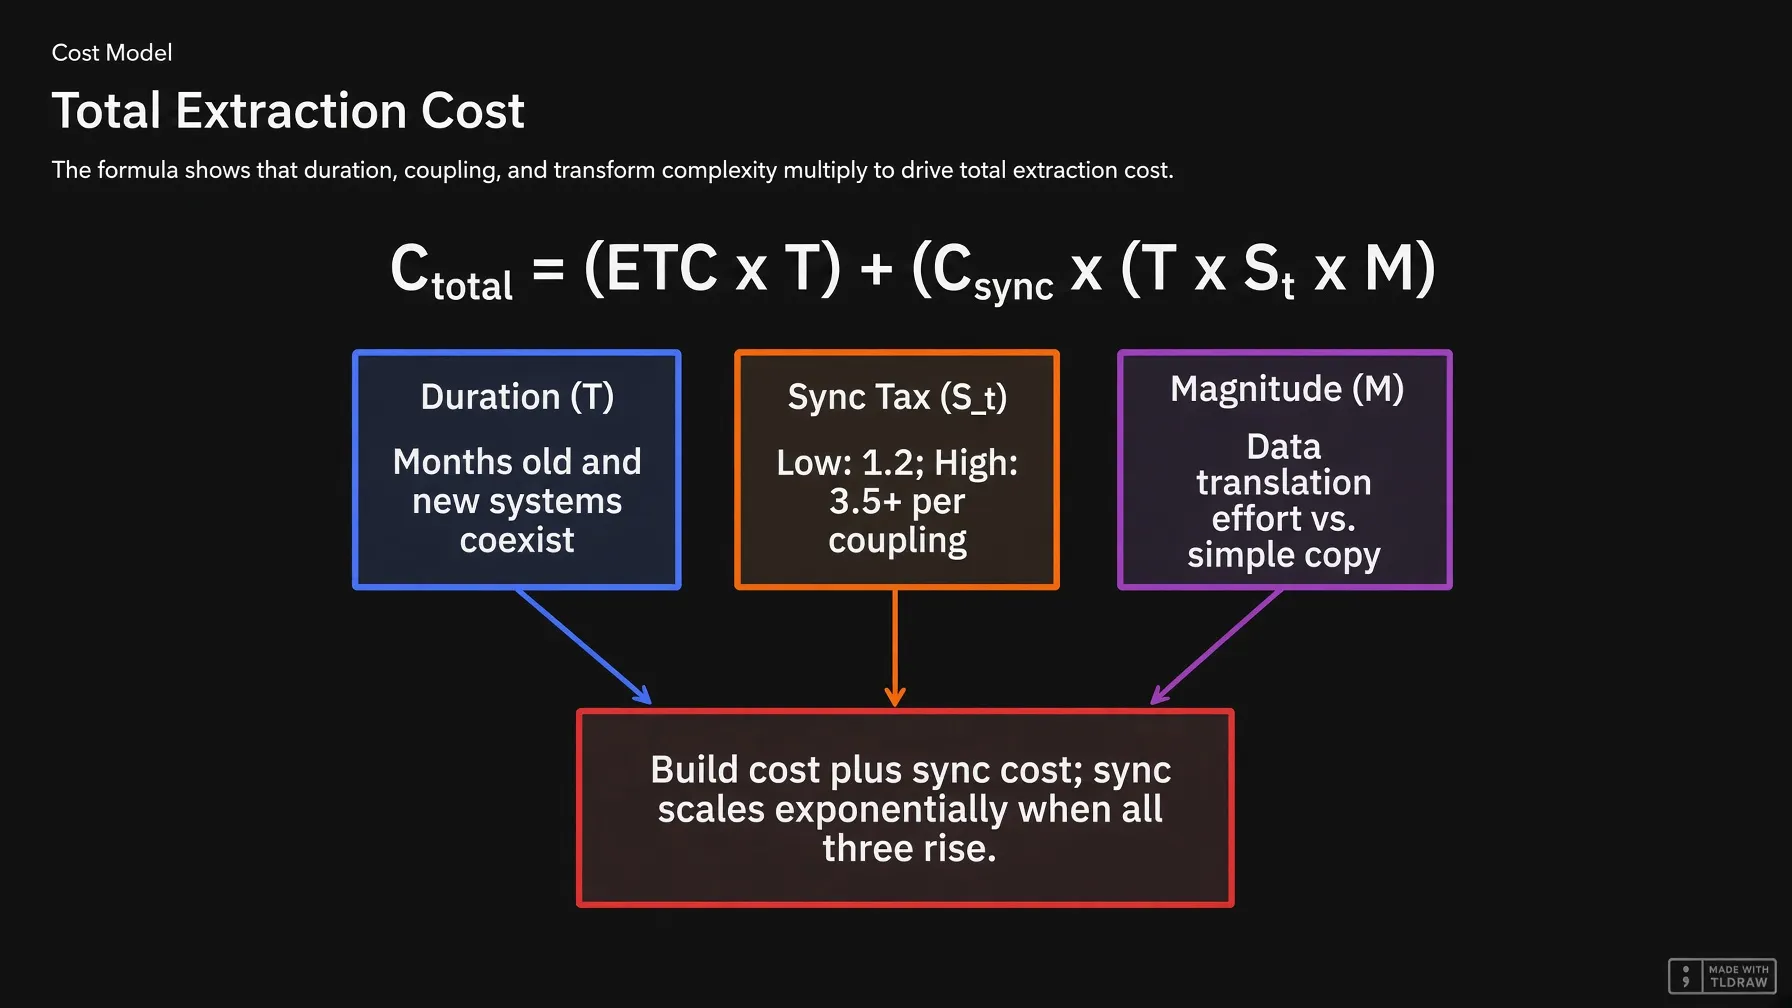
To make the extraction decision rational, leadership needs a way to calculate the total cost of running parallel systems. That cost has two parts: what the company pays to build the new module, and what the company pays to keep the old and new systems in sync while the extraction is in progress. Part one: the build cost. You have a team of engineers building the new module. Call their monthly cost (extraction team cost). If the extraction takes months, the build cost is extraction team cost times . Straightforward.
Part two: the sync cost. This is where the economics get dangerous. The sync layer between the old and new systems has its own cost, and that cost isn’t fixed. It depends on three things that multiply each other.
The first multiplier is duration (, the extraction timeline). Every month the old and new systems coexist, the company pays for the sync layer. Longer duration means more months of sync cost.
The second multiplier is how tightly coupled the platforms are (, the sync tax multiplier). If the bridge is isolated and changes to it don’t break other components, this number stays low (around 1.2). When every integration change forces updates across multiple other parts of the infrastructure, the number climbs (3.5 or higher), and the expense multiplies with it.
The third multiplier is how complex the data transformation is (, the magnitude multiplier). If the old and new infrastructures store data the same way, the sync just copies data from one place to another. That’s cheap, and equals 1. If the new platform restructures data (splitting fields, adding calculation rules, changing formats), the bridge must translate between two different languages. That translation is expensive and gets more expensive as the two codebases drift further apart.
To compute , engineering tracks the actual hours the team spends each month maintaining the sync layer. Those hours cover fixing bugs, updating mappings, and handling edge cases. The team then compares that number against what the sync would cost if both systems had identical data structures and it was just a simple copy:
When , the sync is just copying data. With , the sync layer demands four times the effort of a simple copy, because engineers spend their time writing and maintaining translation logic. Teams calculate this from actual time tracking rather than assigning it from a table.
The sync cost also has a base: what the sync team would cost if the data copy were trivial. Label that baseline (ideal sync maintenance cost per month). Think of this sync cost as the salary of a small team whose only job is to move data from one system to another with zero translation needed.
Now the full formula assembles from these parts. The total cost is the build cost plus the sync cost, where the sync cost compounds through duration, coupling, and transform complexity:
The sync half is multiplicative because duration, coupling, and transform complexity all scale each other. Double any one of them and the sync cost doubles. When all three variables rise simultaneously, which is what happens when leadership allows product changes during extraction, the cost grows exponentially.
4. Clean Extraction vs. Transformed Extraction: By the Numbers
Consider a billing module unbundling with the following inputs:
- Extraction team: 4 engineers at $15K/month = $60K/month ()
- Ideal integration baseline: 2 engineers at $15K/month = $30K/month ()
- Blended hourly rate: $95/hour
Scenario A: Change freeze enforced, extraction completes in 6 months
- (low coupling, sync layer is isolated)
- Actual sync effort = 2 engineers doing pass-through = $30K/month
Scenario B: Product changes allowed during extraction, duration stretches to 24 months
- (high coupling: every new feature forces sync updates)
- Actual sync effort = 8 engineers worth of work (transforms, edge cases, mapping fixes) = $120K/month
That total expense multiplies by 20 times. The integration bridge alone climbs from $216K to $10.08M. Even this figure understates the real damage. Several costs remain excluded:
- Opportunity cost: Features left unbuilt because sync maintenance consumed all engineering capacity.
- Revenue loss: Postponed product launches, delayed market entry, deferred customer requests. A 2025 survey of 300+ enterprise IT leaders found that 60% of migrations triggered missed revenue opportunities.
- Team attrition: Engineers who quit after years of maintaining a sync layer they expected to be temporary.
5. Why Leadership Violates Extractions
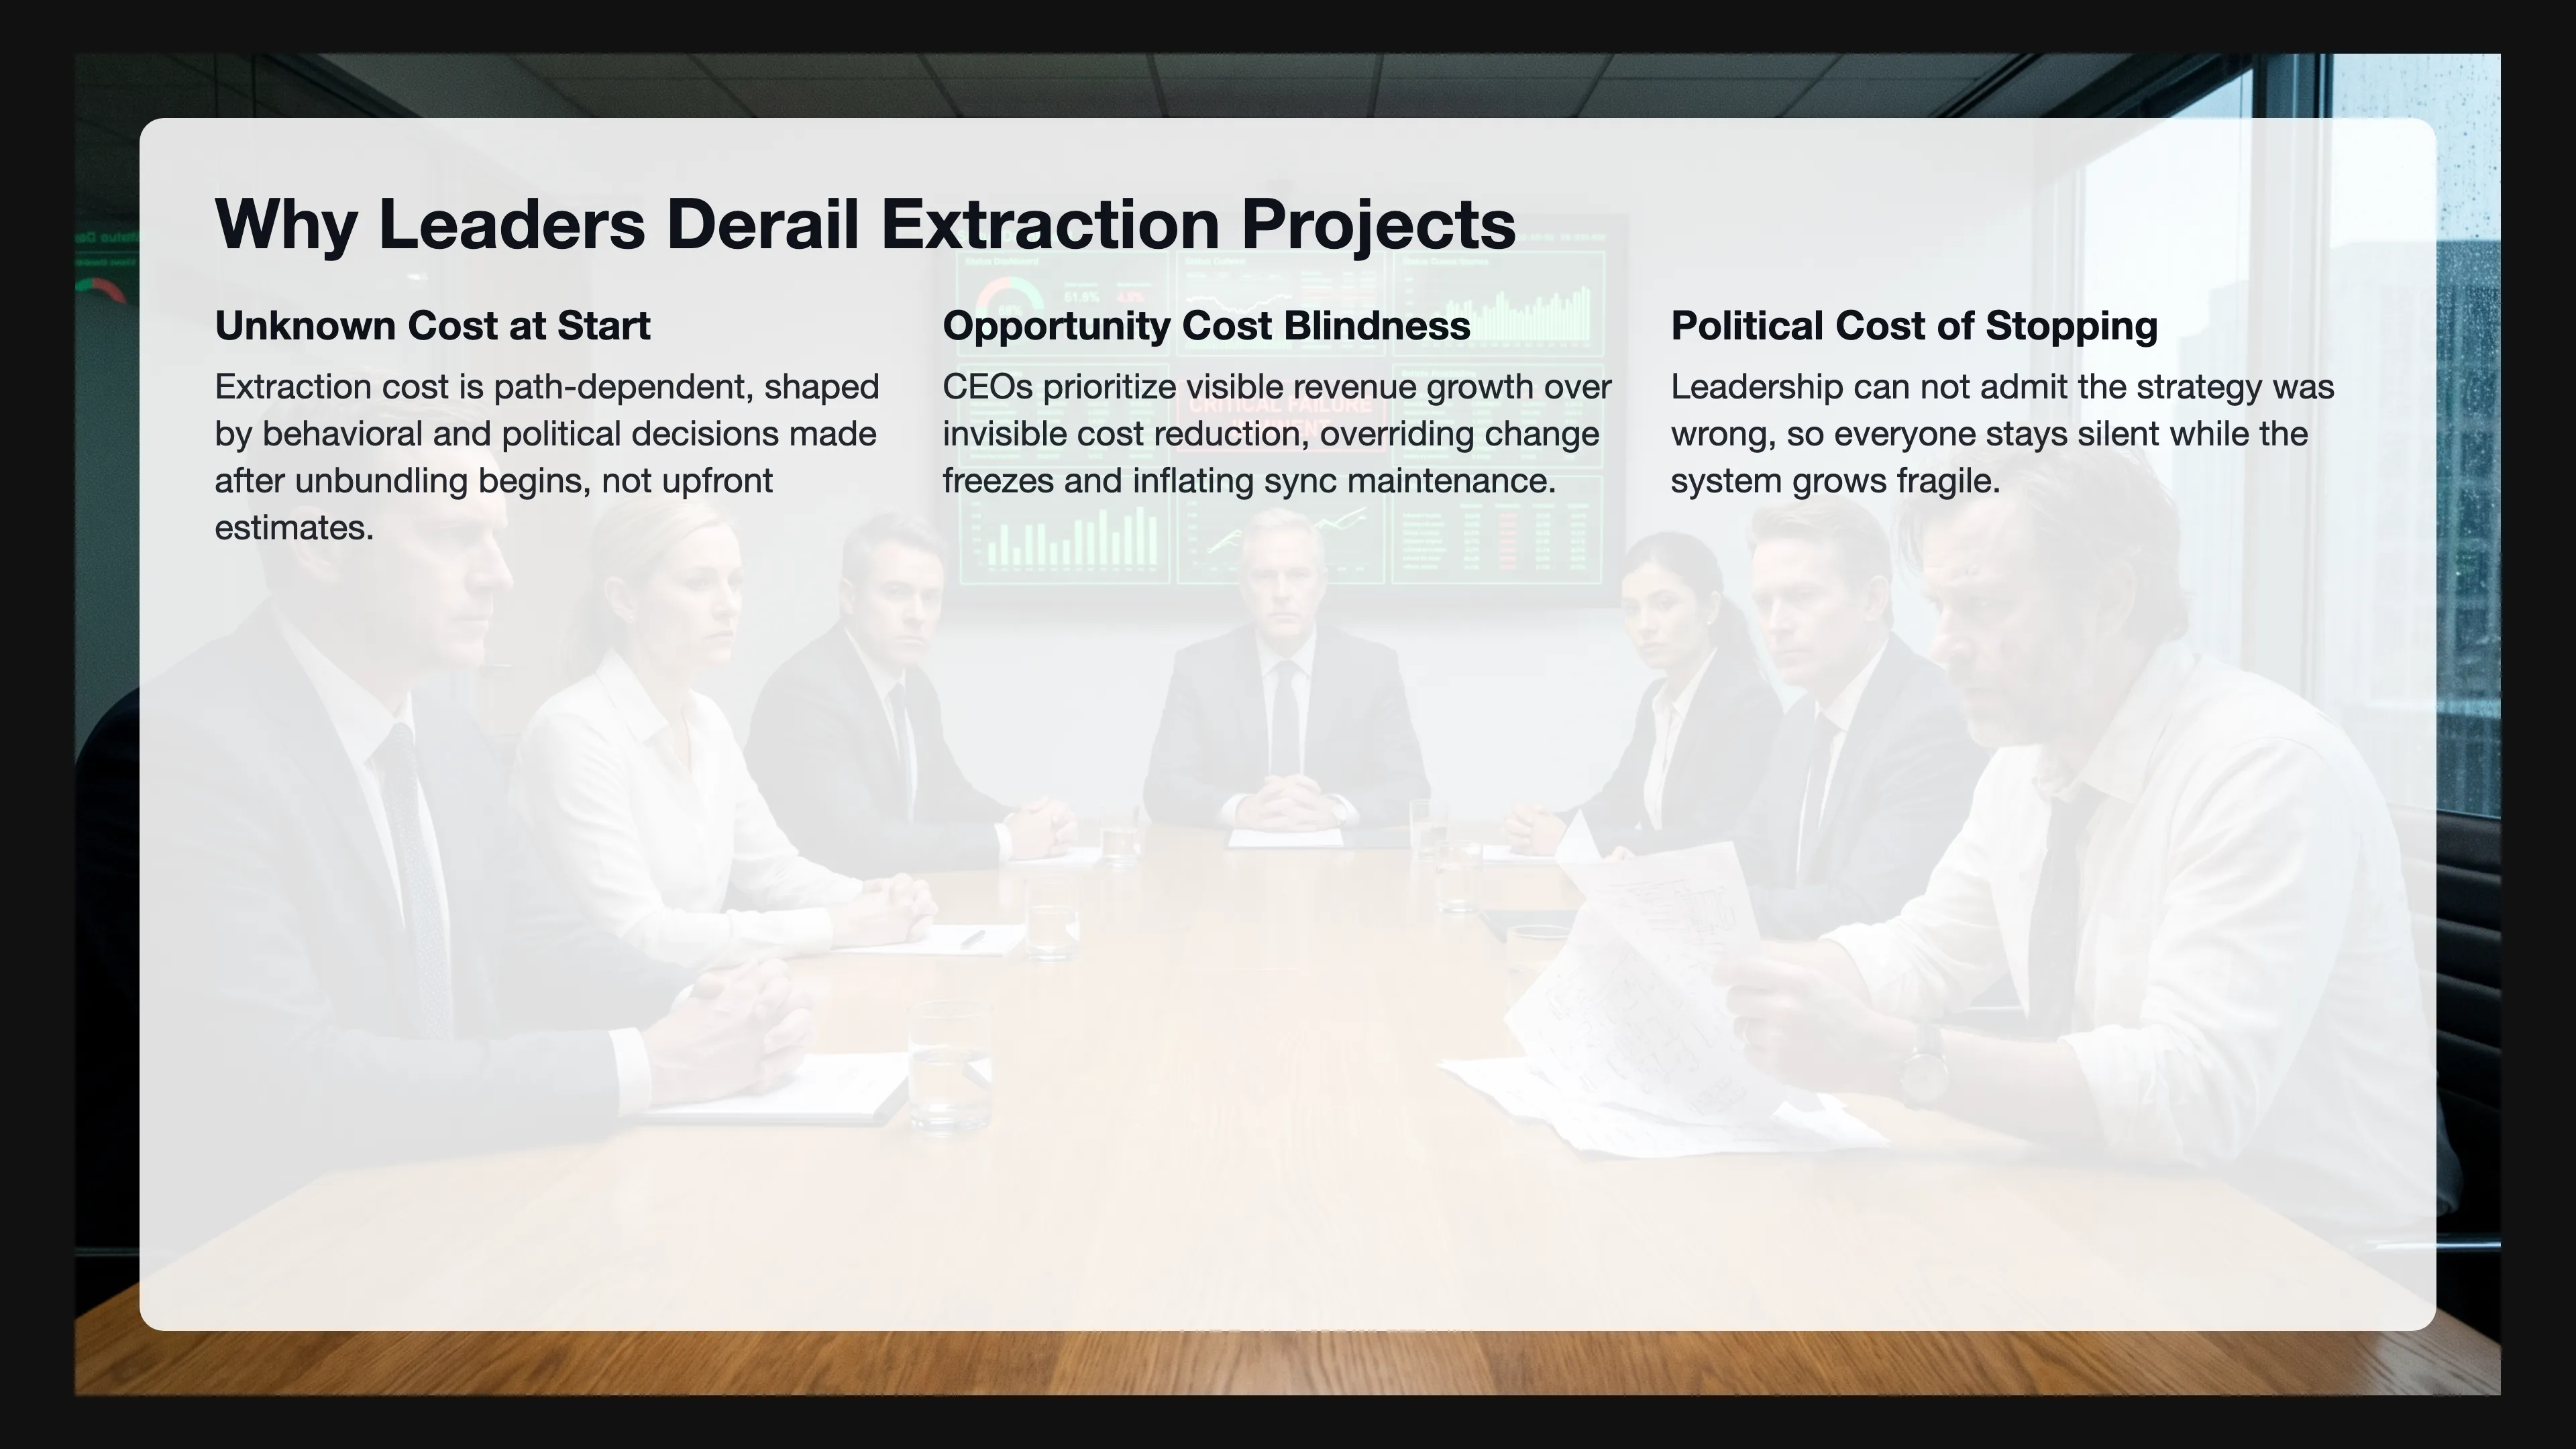
If the economics are this clear, why don’t leaders let extraction projects finish as originally planned? There are three reasons, plus a fourth that explains the rest.
First, the true cost is unknown at the start. Unlike new features with roughly knowable scope, a strangler extraction’s cost is path-dependent. The final bill depends on how many product changes are requested during the parallel state, how much they force the sync layer to transform data, and how long leadership tolerates the overlap. These are behavioral and political variables, not technical. No upfront estimate predicts them because they depend on decisions made after unbundling begins.
Second, they can’t tolerate opportunity cost. Markets reward CEOs for delivering known revenue growth, while cost reduction remains invisible on their scorecard. When product asks for a feature that could increase revenue this quarter, the CEO overrides the change freeze. Every override seems small. Each widens the divergence between old and new systems, raising , inflating the integration expense, stretching . The unbundling enters a death spiral.
Third, they lack the data to prove the damage. Without the cost formula, leadership can’t see the sync layer expense. They bury it under “engineering overhead” or “technical debt” on spreadsheets they never read. When the CEO finally sees that a single feature request during extraction doesn’t cost $50K but $50K plus the extended sync maintenance for every remaining month multiplied by coupling and divergence, the picture changes entirely. The formula makes invisible drag concrete, demanding attention from leadership.
Fourth, the political cost of stopping is higher than the economic cost of continuing. Leadership approved the extraction strategy. Stopping would mean admitting that strategy was wrong. Engineers see the transition fail but can’t speak up without risking their standing. So the organization maintains a self-reinforcing loop: the CEO sees green status dashboards, the CTO sees mounting complexity, and the engineers see both but stay silent. Everyone pretends the separation is on track until the platform forces a decision.
This pattern prevents transitions from ever completing. Companies keep adding layers of complexity until the architecture collapses or an acquisition forces someone else to deal with the mess.
6. Why the Change Freeze Must Be Absolute
Adding cost through the strangler fig pattern is deliberate. That expense is necessary to satisfy present and future demand. Temporarily, the company accepts three implementations for one demand, an investment toward a better architecture. But when leadership violates the original agreement by developing features on the old platform instead of waiting for the transition to finish, that investment becomes a costly malinvestment. Every product change during this window increases the waste without delivering any customer value.
This cost structure becomes explicit through the formula. When product requests a change during the transition, the price tag extends well beyond engineering time for that feature. That change triggers four compounding effects that apply to every remaining month of the unbundling:
Each term captures a different source of cost. Direct cost from the extra time the change adds to the transition comes first (). Sync cost for those additional months follows. Increased coupling () ranks third, making the bridge more expensive for every month remaining (). Transform complexity () comes fourth, growing from the divergence the change creates across every remaining month. All four add up, and the last two multiply against the remaining duration, so a single change early in the unbundling costs far more than the same change near the end.
The extraction demands an absolute change freeze. Leadership must freeze the system until the old one dies.
7. One Leader Changed Everything
Back to the billing module example. Leadership planned the extraction for six months. It took years because they kept approving product changes during the parallel state. The sync layer grew from a simple pipe into a complex transform engine. Leadership promised engineers they would build the future, but those engineers spent their time maintaining the past. The extraction was always possible. Nobody prioritized it because the cost of delay remained hidden and therefore less realistic than the potential revenue increase.
Eventually, a new leader joined who refused to accept the status quo. He convinced leadership to freeze all changes to the billing domain and finish the extraction. Six months later, the old system was gone. Years of failed attempts ended in half a year because one person made the economic case visible and enforced the discipline through strong leadership.
This is the role of the cost formula. It reveals the unknown, transforming “engineers complaining about technical debt” into a balance sheet line item that shows millions in integration expenses that should not exist. When the CEO sees that number, the decision to freeze changes becomes obvious.
8. Implementing the Formula
To use this formula in practice, the engineering organization must track four inputs:
| Input | Measurement Source |
|---|---|
| Monthly cost of the extraction team (salaries plus overhead) | |
| Monthly cost of ideal sync maintenance (measured baseline when sync is simple pass-through) | |
| Sync tax multiplier, calibrated per extraction | |
| Ratio of actual sync maintenance hours to ideal sync maintenance hours, tracked monthly |
Each month during the transition, the engineering manager presents these numbers to the CEO. If starts climbing, it’s an early warning that divergence is increasing. Should exceed the planned deadline by more than 20%, the CEO must make a binary choice: allocate more resources to finish faster, or declare the extraction failed and revert. There’s no middle ground, and the strangler fig pattern only works when the team treats it as a project with a hard deadline, not a strategy with flexible timelines.
The formula only works if the CEO sees unfiltered data. That requires talking directly to engineering teams, not through layers of management. Skip-level meetings and real-time dashboards showing deployment frequency, rollback rates, and incident response times give the CEO a picture that middle management can’t sanitize. If the CEO only hears what the VP of Engineering wants him to hear, the numbers arrive polished and the warning signs disappear before they reach the person who can act on them.
9. Making the Extraction Viable
The strangler fig pattern only makes economic sense when three conditions hold:
-
The extraction has a defined scope. The team knows exactly which component they are extracting and what “done” looks like.
-
Product, engineering, and leadership contractually enforce the change freeze. They sign a document agreeing not to change the extracted component until they decommission the old system and the sync is gone.
-
The engineering manager tracks the cost model periodically. They report total cost, sync tax multiplier, and magnitude multiplier to the CEO every agreed period. If the numbers trend upward, the extraction is at risk and the company’s finances are too.
When these conditions hold, the strangler fig pattern becomes a rational transition strategy. If conditions lapse, it turns into a long-term malinvestment that consumes engineering capacity until the company collapses or makes a different decision.
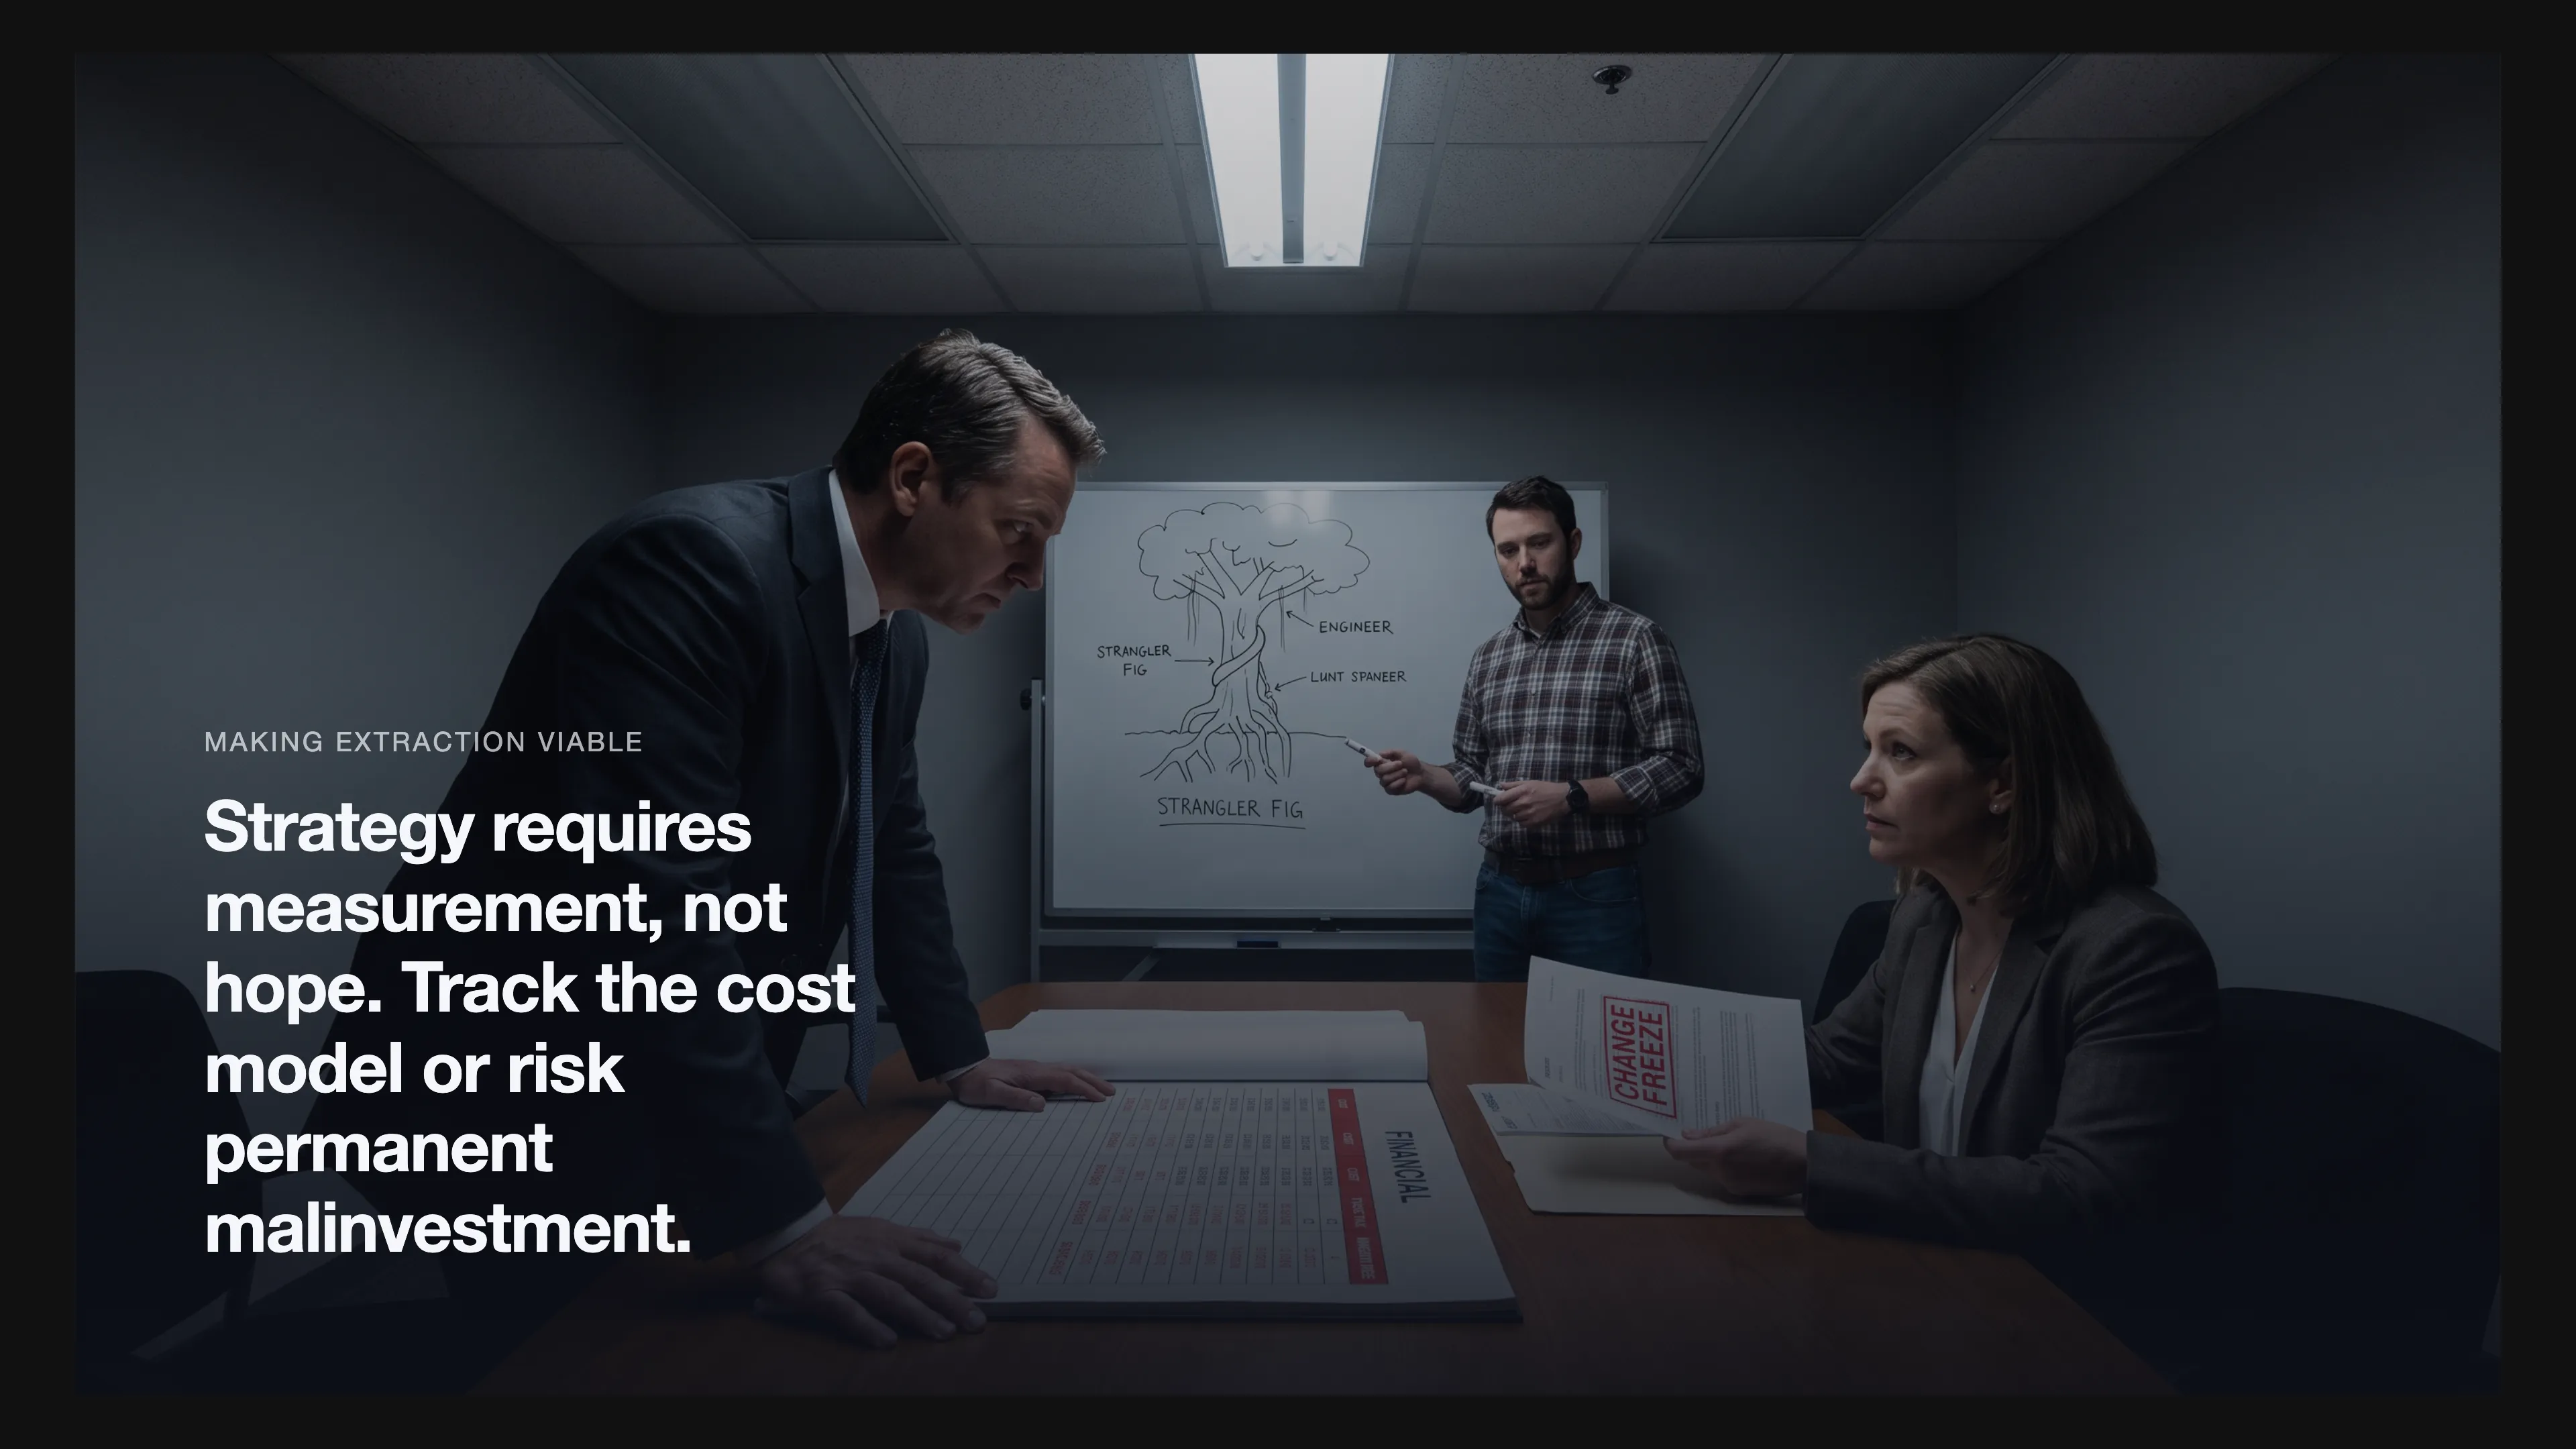
The choice belongs to leadership, the formula belongs to engineering, and the cost belongs to the company because strategy requires measurement, not hope.
References
- Fowler, M., “Strangler Fig Application”. martinfowler.com, June 2004 (updated August 2024). The original formulation of the strangler fig pattern for incremental legacy system replacement.
- Modernization Intel, “Application Modernization Solutions”. Analysis of 186 enterprise modernization projects, 2022-2025.
- Modernization Intel, “Strangler Fig Pattern Example”. Analysis of 29 strangler fig projects, 2022-2025.
- vFunction / Wakefield Research, “Why Application Modernization Projects Fail”. Survey of 250 IT professionals, 2022-2023.
- Paul, R., Dhar, D., Ghose, T., “The Manual Migration Trap”. CloudDataInsights.com, January 2026.
- CloudBees, “The Hidden Costs of Platform Migration”. 2025 DevOps Migration Index, survey of 300+ enterprise IT leaders.
← Previous: Every Change to Your System Risks Breaking Something That Was Working
Up next in The Engineering Tax · Article 20
Coupling Isn't a Binary Switch, and Every Level Has a Price
You are making interface decisions that will bill you for every feature you build after them. The next article connects each dimension of interface design—visibility, domain scope, direction, synchronicity, contract formality, communication, coordination—to a connascence level that feeds directly into the Sync Tax and extraction cost formulas from this one. The first leadership team that sees the price of their choices before making them will cut waste competitors never detect.
Coming soon
Frequently asked questions
What Parallel Systems Cost During an Extraction
How do you calculate the cost of running old and new systems together?
The total is the extraction team's monthly cost times the months they run, plus the ideal sync cost times those same months times the sync tax multiplier times the magnitude multiplier. Magnitude is actual sync maintenance effort divided by the effort a simple copy would take. When the data models match, magnitude is 1. When the new system splits fields and adds rules, magnitude climbs. In the article's billing example, a six-month freeze with low coupling and magnitude 1 costs $576K. Allowing product changes for 24 months, with the sync tax at 3.5 and magnitude at 4, costs $11.52M.
Why does one feature request during an extraction cost more than the feature?
The change adds four effects that apply to every remaining month: extra duration on the extraction team, sync cost for those extra months, higher coupling on the months still left, and higher transform complexity on the months still left. The last two multiply by the time remaining, so the same change early costs more than the same change near the end. The extraction stays an investment only while the change freeze holds. A product change on the old platform turns the temporary third implementation into malinvestment.
How to Extract Modules Without Burning Millions
Why do strangler fig extractions usually fail?
Research shows 67 to 79 percent of application modernization projects fail. The pattern itself works. Leadership fails because they won't treat the extraction as a finite project with a hard deadline and a change freeze. Companies end up running three systems: the old one, the new one, and a brittle sync layer between them.
How do you extract a module successfully?
Form the team from existing employees. Define a clean interface compatible with the legacy system. Build the module as a standalone unit. Route traffic through a proxy and cut the old code. Treat it as a surgical operation with a clear finish line. Running two systems in parallel means maintaining three implementations for the price of one customer.
Newsletter
Be the first to get next articles in this series.