The Engineering Tax · Article 28 of 29
The Build Is a Down Payment on a Liability Nobody Budgets For
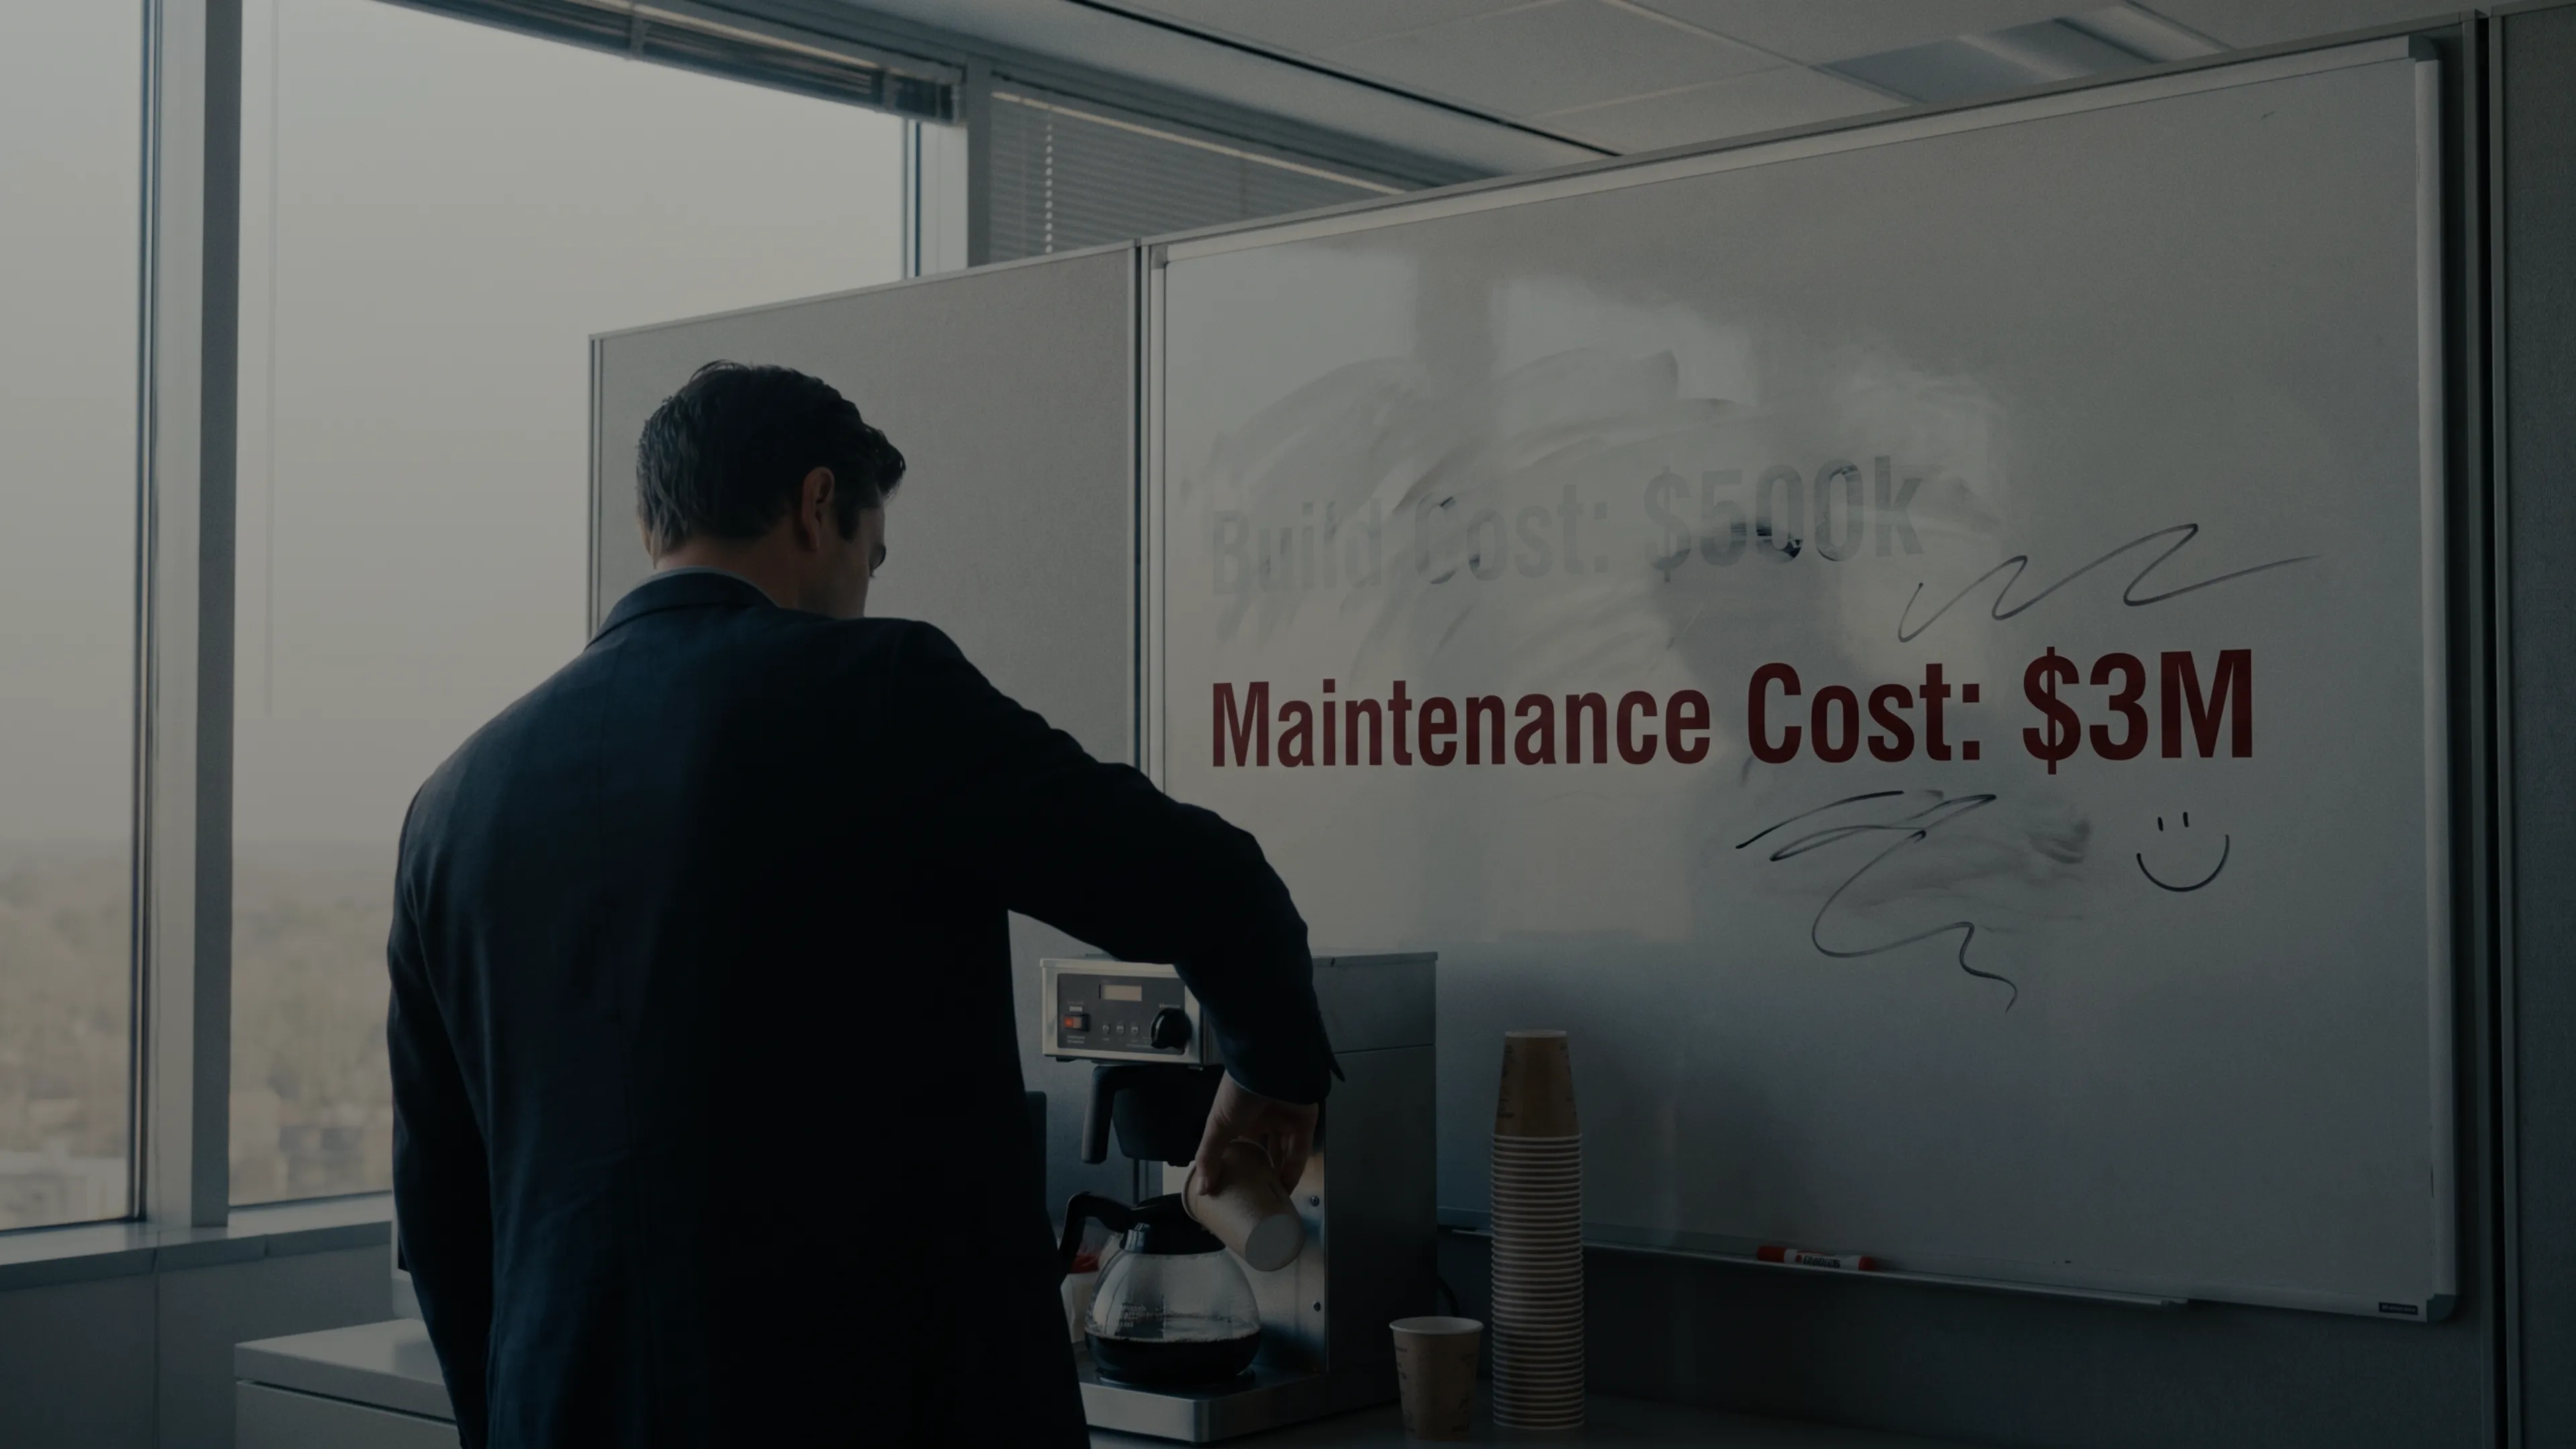
The interface classification you just saw exposes a liability that compounds invisibly. The next article unpacks Barry Boehm's 60/60 rule to show why the build cost is a down payment on a maintenance bill that never lands on the same spreadsheet. When the unaccounted work from interdependence consumes 30% of engineering capacity, the architecture you choose today determines whether your cost curve stays flat or accelerates.
Why the Real Bill Never Shows Up on the Same Page
1. Why Maintenance Eats the Budget
A founder raises capital, hires engineers, and ships a product. The burn rate is high but understandable. Building software costs money, and that’s common knowledge.
The trap is that the common knowledge is wrong. Building is the cheap part. Barry Boehm’s research, consolidated across decades of software engineering economics, shows that maintenance consumes between 50% and 80% of a software system’s total lifetime cost. The commonly cited “60/60 Rule” is even more specific. Maintenance represents roughly 60% of lifecycle cost on average, and within that maintenance bucket, 60% consists of user-generated enhancements. “User-generated enhancements” is Boehm’s term for changing requirements, which is to say the customer changes their mind, the market shifts, the regulation changes, or the competitor ships a feature they now need to match. Changing requirements, not bug fixes or server upgrades, drive the majority of maintenance spend.
When you add migration activities, which are themselves a form of changing requirements, over 80% of maintenance work relates to requirements that shifted after engineers built the system. The software didn’t break. The world changed, and the software had to change with it. The structural lesson is that maintenance dominates because the world the software lives in keeps moving, not because engineers write bad code. Frameworks deprecate, security vulnerabilities emerge, customer expectations rise, regulations tighten, and the system has to keep up or it loses value.
One caveat shapes everything that follows. The penalty gets worse as the system grows. A tightly coupled monolith with three engineers is actually the cheapest thing to run. Coordination is trivial, overhead is near zero, and everyone knows the whole system. The maintenance burden only becomes crushing when the system reaches a size where the engineers can no longer hold it all in their heads at once. The architecture forces every change to drag unrelated parts of the system along with it. This is why a 50-person engineering team running the same architecture that worked fine at 5 people is a financial crisis waiting to happen. The shape of the system matters more than the size of the team.
This should reshape how every company thinks about software economics. The initial build is a down payment on a liability that will demand continuous feeding for the life of the product. Yet companies budget as if building is the whole story. They raise capital for development, track infrastructure costs in a separate spreadsheet, and treat engineering headcount as a fixed operational expense with no breakdown between creating value and keeping the existing system alive.
2. Boehm’s 60/60 Rule and the Real Cost of Change
Boehm’s numbers aren’t an academic curiosity. They explain why software companies that look profitable on paper collapse under their own weight after product-market fit. The product works and customers pay, but every new feature, every regulatory change, and every framework deprecation forces the engineering team back into the codebase. That work isn’t free, and it isn’t optional.
The textbooks break maintenance into four buckets: perfective work covers enhancements and tuning, corrective work covers bug fixes, adaptive work covers framework upgrades and compliance changes, and preventive work covers proactive improvements. That last one gets about 4% of the budget in most organizations, which tells you everything you need to know about how companies treat maintenance.
These four categories describe a healthy system. They don’t describe an interdependent system. In an interdependent system, a significant slice of maintenance isn’t about fixing bugs or adding features. It’s about keeping components that shouldn’t need to talk to each other in sync, about manual data reconciliation, about emergency patches for coupling-related incidents, and about meetings.
That slice has no standard name in the literature. It exists in every software company, but interdependence makes it grow non-linearly as the system scales.
3. Costs Scattered Across Buckets
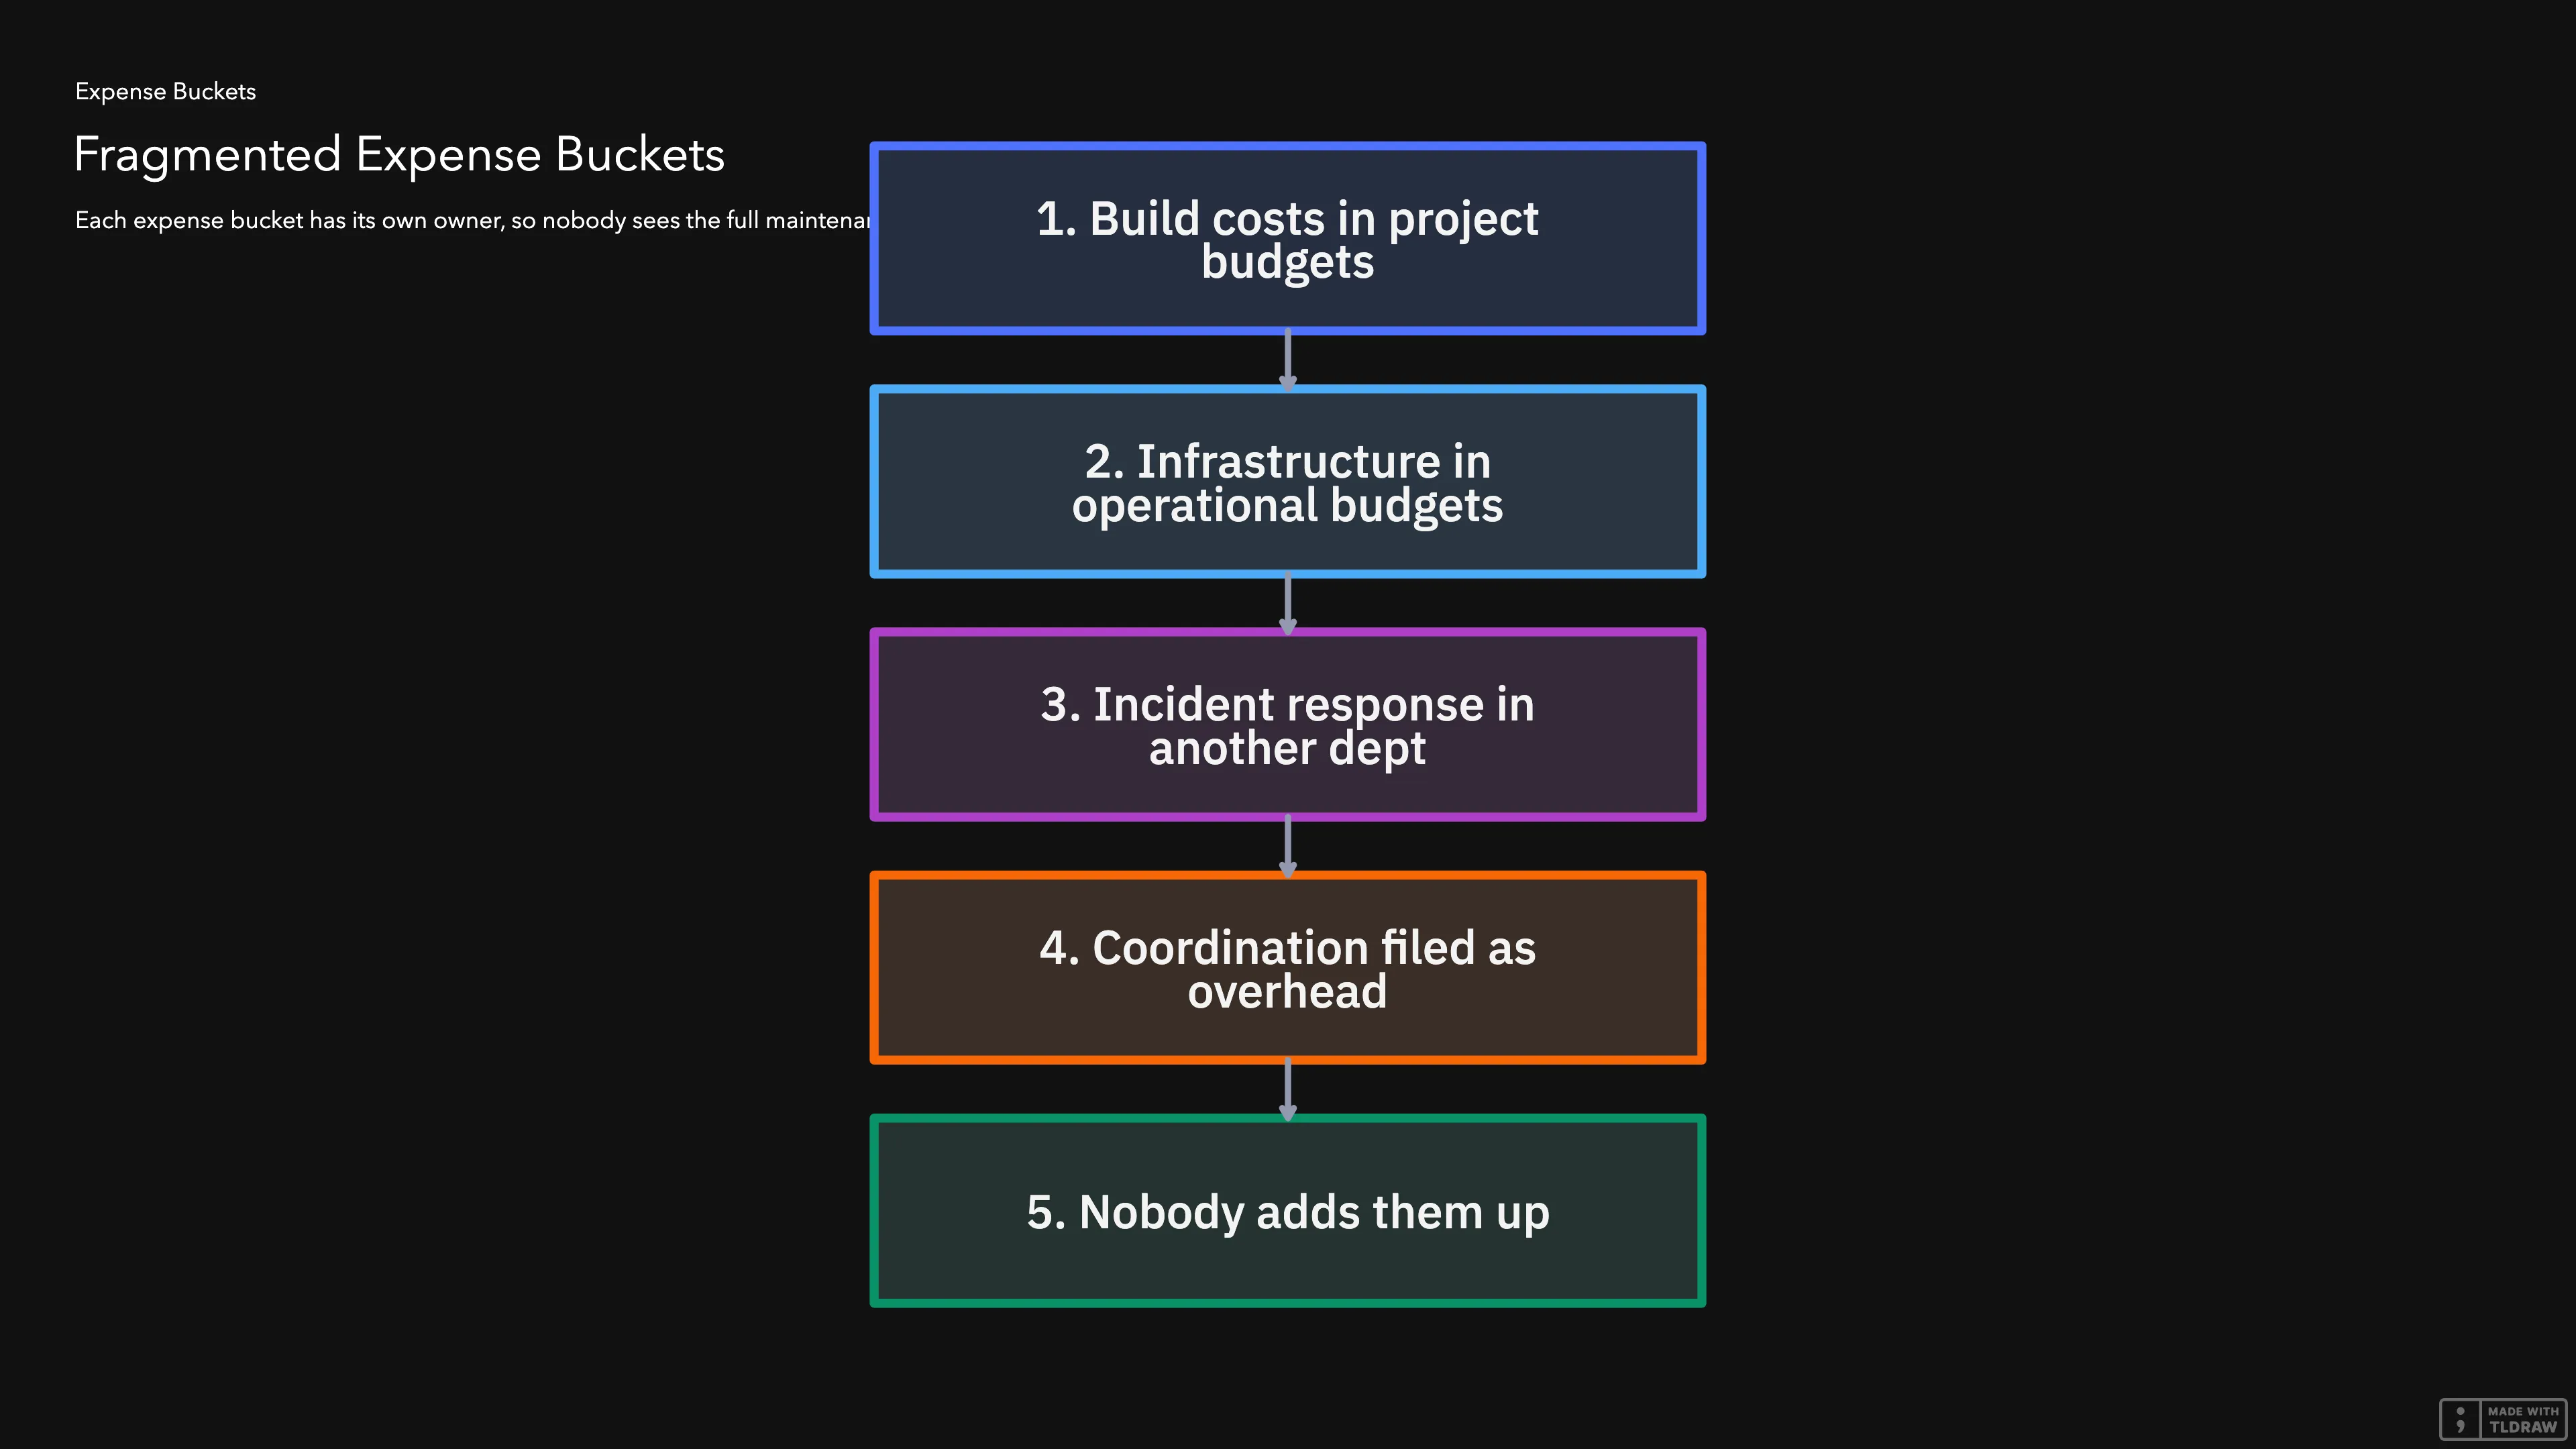
Maintenance costs money, but fragmentation hides the real damage. Nobody sees the full bill because expenses live in separate buckets.
Building costs live in project budgets, infrastructure lives in operational budgets, incident response lives in yet another department, and coordination meetings get filed under “project management overhead”. Each bucket has its own owner, its own chain of command, and its own spreadsheet. Nobody ever adds them up.
This fragmentation has consequences. When a CEO approves a new feature, he sees the build estimate. He might see the infrastructure estimate. He almost never sees the maintenance estimate, because maintenance hasn’t happened yet and nobody can predict exactly what the market will demand. But the CEO also doesn’t see the unaccounted work this feature will add to the existing system, because that cost lives in engineering overhead, incident response, and coordination meetings. It’s real money, real hours, and real salary, but nobody connected it to the decision that created it.
Research from Accenture found that executives allocate between 17% and 24% of IT budgets to technical debt remediation. SonarSource calculated $306,000 per year in technical debt cost per million lines of code, equivalent to 5,500 developer hours. These numbers exist in reports. But they don’t exist in the same view as the new feature budget. So when leadership compares “build this feature” versus “don’t build it”, the comparison rigs itself. The yes side shows a clear number. The no side shows nothing, because nobody attached the maintenance and the unaccounted work to the feature that creates them.
4. The Costs Nobody Tracks
Even the companies that try to track maintenance miss most of it. The untracked costs are consistent across industries and company sizes:
- Internal labor on incidents: When a production incident happens, engineers respond. Companies rarely track those hours as maintenance. They charge them to operations, or absorb them into regular engineering headcount.
- Coordination meetings: Every cross-team alignment session, every architecture review that a shared database change forces, every Slack thread about breaking changes. These hours are real but unbudgeted.
- Integration management: Internal IT labor spent managing systems that no one designed to work together, maintaining brittle glue code, and updating ad-hoc scripts.
- Workarounds: Spreadsheets and manual processes exist because the “real” system can’t handle actual workflows. These are costs disguised as business process.
- Opportunity cost: Revenue that maintenance prevents the company from earning because engineers maintain instead of building. Companies almost never track this.
- Training and documentation: Onboarding new team members onto a complex interdependent system takes longer than onboarding them onto a modular one. Nobody connects that extra time to architectural choices.
- Preventive maintenance: Only 4% of maintenance budgets in typical organizations. Companies run their systems until they break, then pay exponentially more to fix them.
These costs don’t appear on the same spreadsheet. Some don’t appear on any spreadsheet. When leadership makes decisions based on incomplete data, the decisions are wrong by definition.
5. When Interdependence Becomes Expensive
Interdependence isn’t the same as a monolith. A tightly coupled monolith with three engineers is actually the cheapest thing to run, as established in section 1. The worst interdependent systems are distributed monoliths. These are architectures where engineers extracted every component into its own service or microservice, but the components still depend on each other. They share data stores, call each other in real time, make implicit assumptions about each other’s data structure, or depend on manual scripts to stay consistent. These systems inherit the operational overhead of distributed computing, network latency, deployment complexity, and observability requirements, while keeping all the coordination costs of tight coupling. They have the disadvantages of both architectures and the advantages of neither.
Research comparing architectures found that monolithic systems exhibit non-linear cost growth as scale increases, while modular systems maintain a flatter cost curve. At steady state, modular architectures show approximately 26% lower operational costs. But the shape of the curve is the number that matters. Interdependent costs accelerate. Modular costs don’t.
This creates what I call the double penalty of interdependence.
Interdependent systems carry a first penalty: they simply cost more to maintain. Every coupling point is a coordination tax that never stops accumulating. Shared databases introduce synchronized deploy risks that become more expensive with every release. And each implicit dependency is a future incident waiting to happen at the worst possible moment.
Second penalty: maintenance costs become harder to identify and quantify. In a modular system, each module has an owner and a defined interface. When that module demands maintenance, the cost is attributable. In an interdependent system, there are no clean boundaries. The engineer fixing a bug caused by implicit coupling can’t say “this belongs to the billing module” because the bug exists in the space between modules. The cost is real but unassignable.
So interdependence makes maintenance more expensive and harder to see, because the cost lives in the space between modules and nobody can attribute it to a single owner.
6. The Unmeasured Tax of Interdependence
The work this section is about is the unaccounted engineering effort that exists only because components are interdependent when they shouldn’t be. In a modular system, components communicate through clean interfaces, and this work is zero. In an interdependent system, every coupling point adds more of it, and the total grows faster than the system does.
This includes:
- Manual data reconciliation between systems that should exchange clean contracts
- Emergency patches for coupling-related incidents
- Cross-team alignment meetings forced by shared state
- Maintenance of sync or transform layers between divergent data models
- Regression testing that grows exponentially with coupling degree
- Documentation of implicit dependencies that no tool can verify
This work is a sub-item inside maintenance. It sits alongside corrective, adaptive, perfective, and preventive maintenance. The difference is that the other four categories exist in every software system. This work only grows with interdependence.
In a small system, this work is negligible. In a distributed monolith with fifty engineers, it can consume 30% or more of total engineering capacity. The engineers aren’t building features. They’re paying a tax that the architecture created, and that tax compounds every quarter because each new feature adds more coupling points.
7. Passive Income Is a Delusion
There’s a persistent myth among new entrepreneurs that software is passive income. The argument goes like this: the marginal cost of serving one more customer is near zero. No factory, inventory, or shipping stands between the product and the customer. Build it once, sell it forever.
The argument confuses two different costs. Marginal cost is the cost of serving the next customer. Total cost is the cost of serving all customers, including the cost of keeping the system itself alive. Software wins on marginal cost and loses on total cost, because the total cost is dominated by maintenance, and maintenance scales with how much the world changes around the product. The founders who build on the passive income story miss this. They raise capital, scale the team, and ship features, then wake up three years later with a product that works but a cost structure that can’t support it.
The moment you stop investing in maintenance, the product falls behind. Frameworks deprecate, security vulnerabilities emerge, customer expectations shift, and competitors add features, so the system that looked profitable last quarter looks obsolete next year. The maintenance bill, fragmented and untracked, finally becomes too large to ignore. By then, the architecture is so interdependent that fixing it costs more than starting over.
8. Why Everyone Plays the House of Cards
If the costs are unbudgeted and the consequences are predictable, why don’t companies fix this?
Because it’s a house of cards, and everyone has a reason to keep it standing.
Investors want growth narratives. They don’t want to hear that 60% of future engineering capacity will go to maintenance. They want to hear about new features, new markets, and expanding margins.
Boards measure CEOs on revenue growth and valuation, not on maintenance efficiency. When a CEO sees a feature that could increase revenue this quarter, overriding a maintenance budget is rational from his perspective. Leadership fragments and defers the maintenance cost. The revenue is immediate and measurable.
Tech leaders face a different pressure. They know the visible costs don’t reflect reality. They know that accurate maintenance estimates would kill projects or cut budgets. So there’s a temptation, sometimes unconscious, to make numbers look more promising. They round down the unaccounted work, treat coordination overhead as “just how engineering works”, and present the build estimate without the maintenance reality attached.
This isn’t always dishonesty. Sometimes the tech leader genuinely can’t calculate the exact number. Interdependence makes attribution impossible. But experienced tech leaders know they’re underestimating. They know the real cost is higher than what’s on the slide. And they stay silent because accurate numbers would kill the project.
The result is a shared delusion that everyone involved tacitly accepts. The participants know the numbers are inaccurate, but speaking up serves no one’s interests. Pretending the estimates are correct benefits everyone in the short term. And the company accumulates untracked debt until the structure collapses under its own weight.
9. What Leadership Should See Instead
The solution is a unified view, not another framework.
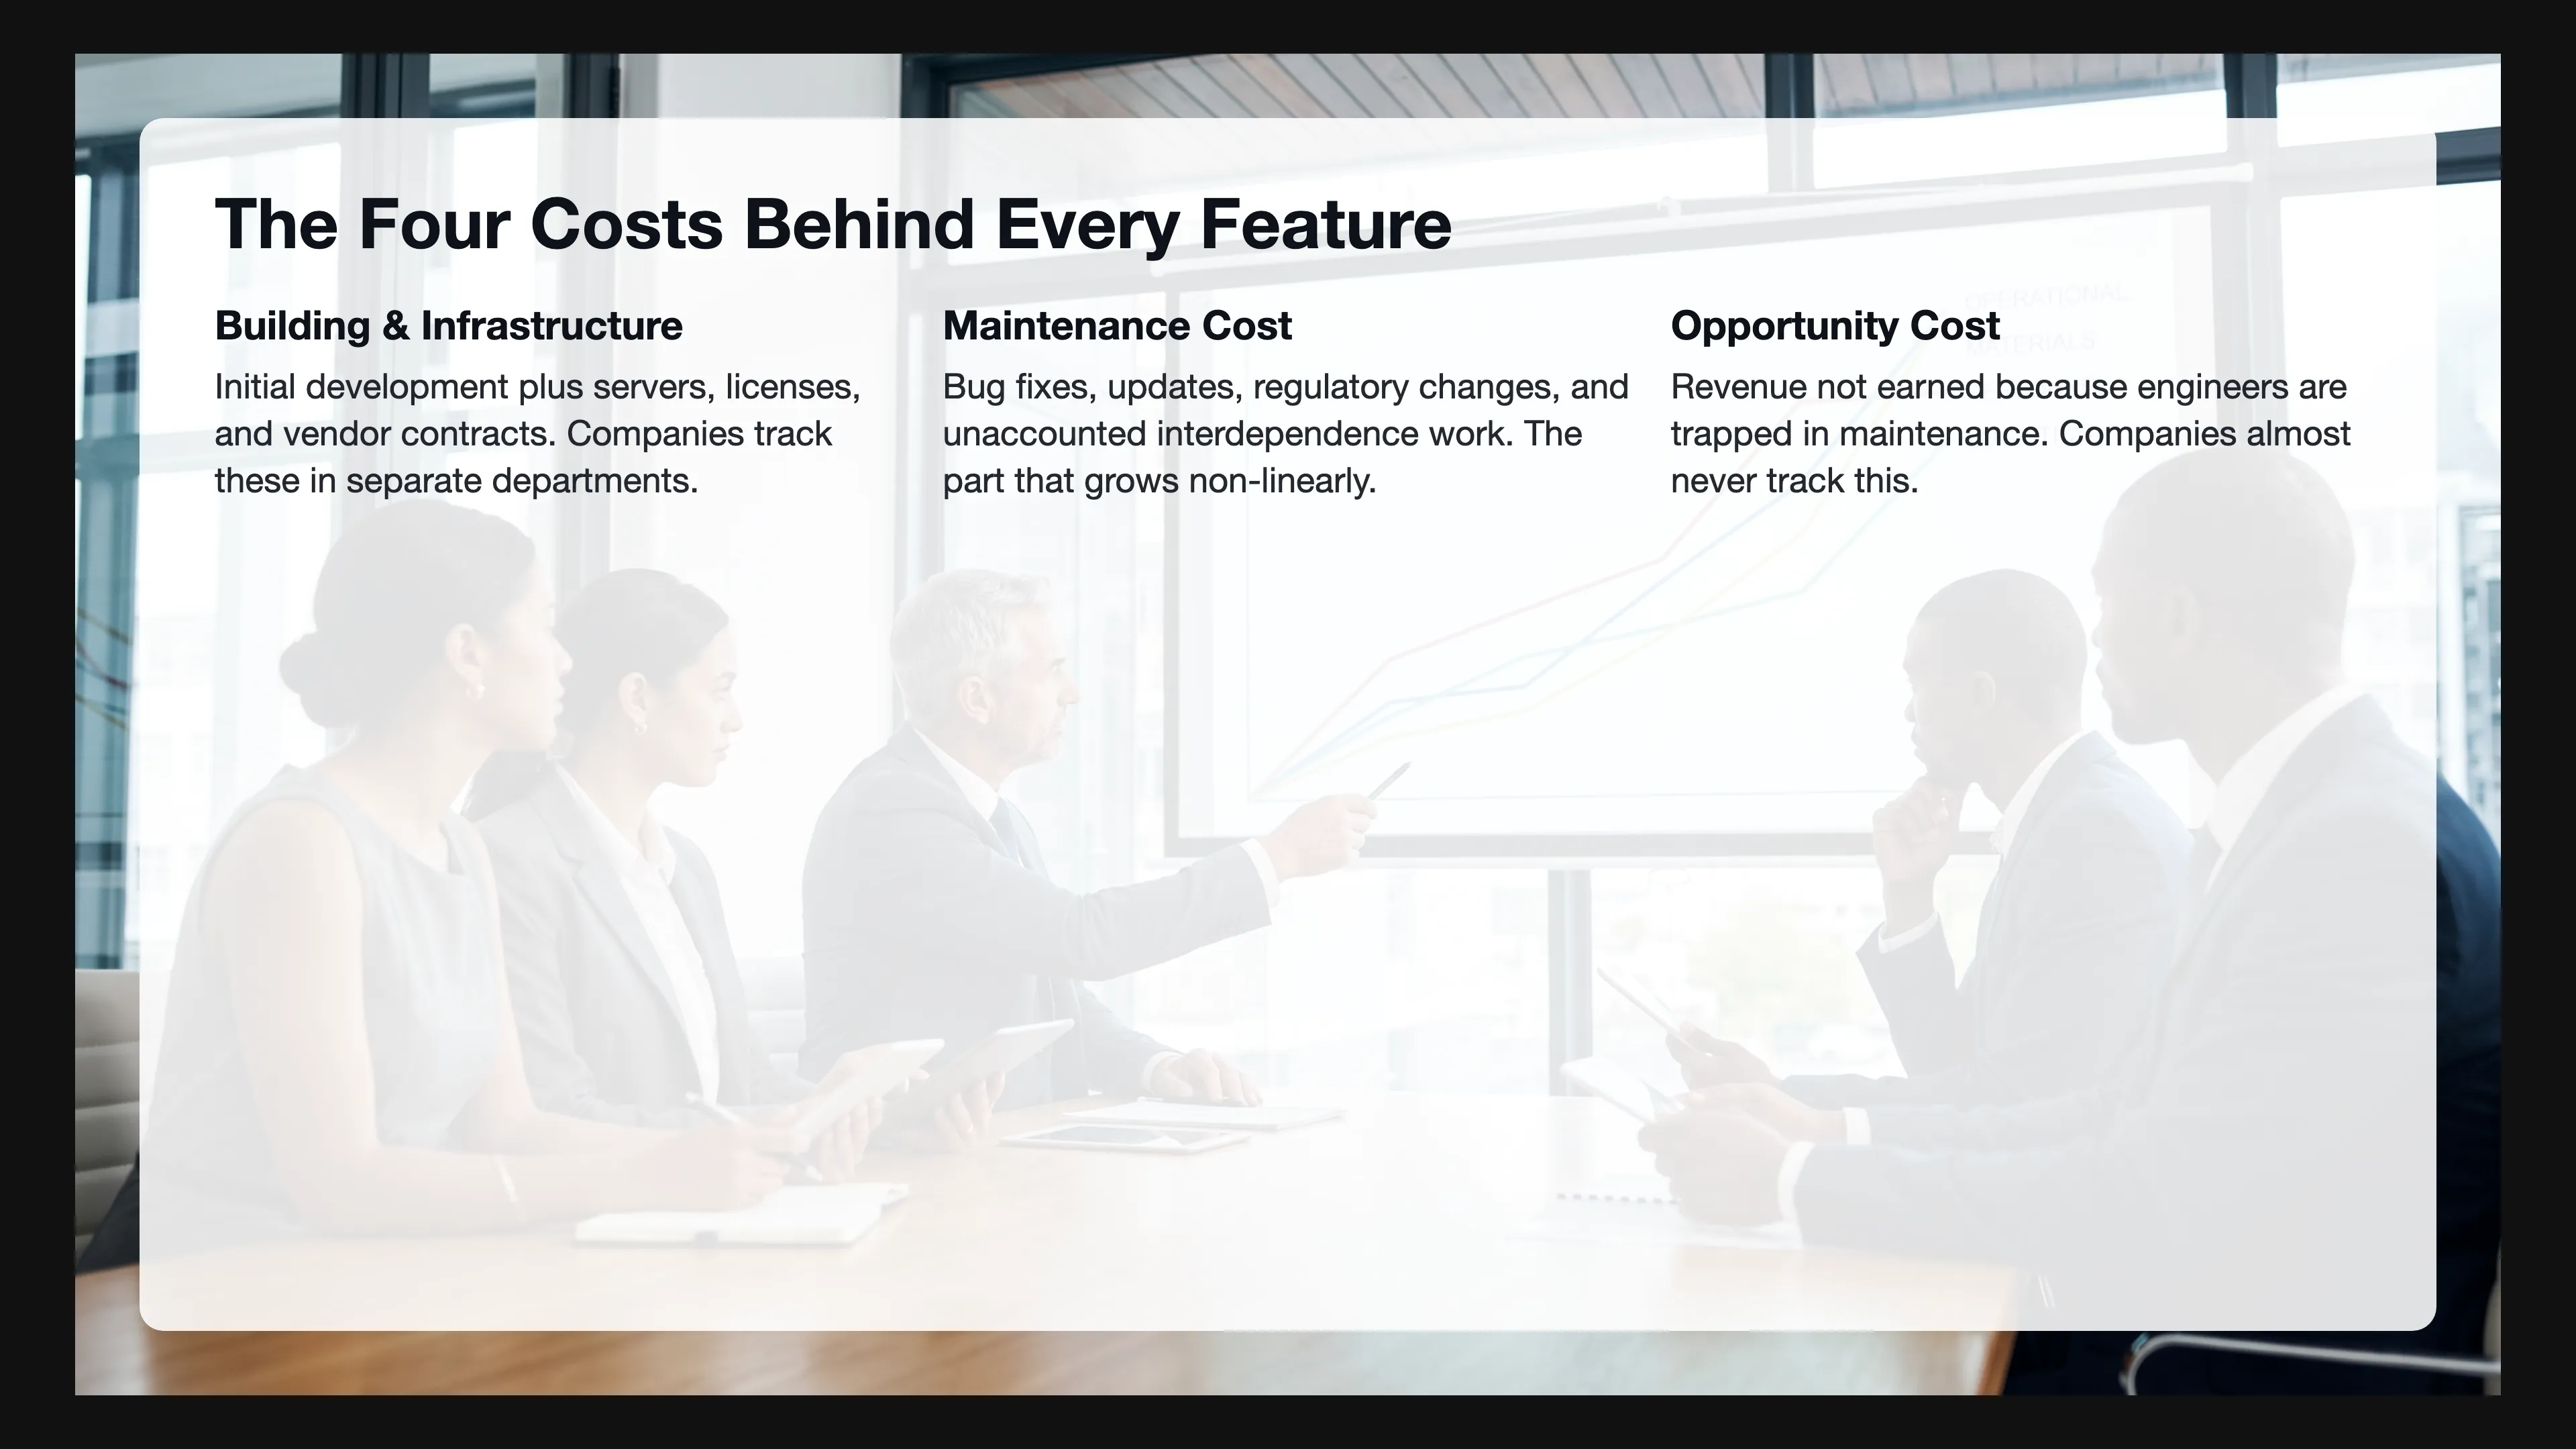
Before approving any feature, leadership should see four cost categories on the same page:
- Building cost: The initial development. This is what companies already track.
- Infrastructure cost: Servers, licenses, SaaS tools, vendor contracts. Companies already track this, usually in a different department.
- Maintenance cost: Bug fixes, environment updates, enhancements, regulatory changes, and the work that exists only because components are interdependent. Companies partially track the first four and almost never track the last one. Maintenance breaks down further:
- Standard maintenance: bug fixes, environment updates, enhancements, regulatory changes. Companies partially track this but rarely connect it to the feature that creates it.
- Unaccounted work generated by interdependence: coordination, sync maintenance, coupling incidents, manual workarounds. Companies almost never track this. This is the piece that grows non-linearly with interdependence, and it’s the piece leadership has the least visibility into.
- Opportunity cost: Revenue not earned because engineers are trapped in maintenance instead of building. Companies never track this.
The goal isn’t to predict exact numbers. Nobody can predict what the market will demand or which frameworks will deprecate. The goal is to show that maintenance isn’t a separate budget. It’s part of the same decision as building.
For the interdependence penalty specifically, use the existing formulas. The Sync Tax Multiplier is a number that multiplies the cost of any change in an interdependent system. A feature that should cost 1 unit in a clean architecture might cost 4 units in a tangled one, and the exact multiplier depends on how coupled the system has become. The Scenario Simulations project how the cost gap between a disciplined architecture and a fast-but-tangled one widens year by year. These formulas don’t predict absolute maintenance cost. They predict the multiplier that interdependence applies to whatever your baseline turns out to be. Nobody knows the absolute number. The penalty is knowable.
Tech leaders should quantify costs as accurately as possible, even when the numbers look bad. Resist the temptation to make estimates more promising so the CEO approves more easily. Honest numbers protect the company from surprises. Dishonest numbers protect the project from rejection, but they guarantee that the surprise will arrive later, when it’s more expensive and harder to fix.
10. Conclusion
The choice every company makes is not “build or don’t build”. It’s “build how, when, and at what ongoing cost”. The shape of the architecture decides the shape of the maintenance bill, and the maintenance bill is the bill. Boehm showed this decades ago, and every year a fresh batch of companies learns it the hard way.
The unified view makes the choice honest by attaching the maintenance and the unaccounted work back to the decisions that created them. Leadership sees the full bill and decides whether the feature is worth what it really costs. That decision can still be yes, and often it should be, but it should be made with the numbers in front of everyone.
References
- Barry Boehm, “Software Engineering Economics” and related papers (CMU) — Foundational research on software lifecycle costs, including the 50-80% maintenance cost range and the 60/60 rule showing maintenance consumes ~60% of lifecycle cost.
- The 60/60 Rule (Software Maintenance Overview) — Detailed breakdown of the 60/60 rule: 60% of lifecycle cost is maintenance, and 60% of maintenance effort is driven by user-generated enhancements.
- ISO/IEC/IEEE 14764 — Software Maintenance Classification (Wikipedia) — Standard classification of maintenance into corrective, adaptive, perfective, and preventive categories.
- Accenture, “Build Your Tech and Manage Your Debt” (2024) — Research finding that executives allocate between 17% and 24% of IT budgets to technical debt remediation.
- SonarSource, “Cost of Technical Debt: New Research” (2023) — Analysis calculating $306,000 per year in attributed technical debt cost per million lines of code, equivalent to 5,500 developer hours.
- Software Maintenance Cost Benchmarks (Pegotec) — Industry benchmarks showing preventive maintenance at approximately 4% of maintenance budgets, based on IEEE/ISO standards data.
- Martin Fowler, “Monolith First” — Discussion of the distributed monolith anti-pattern and strategies for modular architecture, cautioning against premature distribution.
- Z. Gao and Z. Liu, “Microservices Architecture Versus Monolithic Architecture: Technical Trade-offs and Economic Analysis” (2025) — Economic analysis comparing non-linear cost growth in monolithic systems against flatter cost curves in modular architectures.
Measure it
Price the maintenance bill the build cost hid
Boehm's 60/60 rule puts roughly 60% of lifetime cost in maintenance, most of it from changing requirements. In a tangled system that untracked work can consume 30% of capacity, and the calculator prices the Sync Tax inside it.
Up next in The Engineering Tax · Article 29
The AI Boom Is a Broken Signal Distorting the Software Market
The $20 ChatGPT subscription you approved last quarter is a lie, and the cost that never appears on your P&L is already shaping your company's next hiring plan. The next piece in this series exposes the AI subsidy that has hijacked demand and sent capital into projects that can't survive on their own economics. When the subsidy ends, the decisions you made at the fake price will come due, and only the companies that built on real demand will see their investments survive.
Coming soon
Frequently asked questions
The Real Cost of Software Maintenance vs Building
How much does software maintenance really cost?
Barry Boehm's research shows maintenance consumes 50 to 80 percent of a system's total lifetime cost. The 60/60 Rule is more specific: maintenance is roughly 60 percent of lifecycle cost, and within that, 60 percent comes from changing requirements. That means the world changed and the software had to change with it.
Why do interdependent systems cost more to maintain?
In a clean system, maintenance splits into enhancements, bug fixes, upgrades, and proactive improvements. In an interdependent system, a significant slice goes to keeping components in sync that shouldn't need to talk to each other. Manual data reconciliation. Emergency patches for coupling-related incidents. Meetings about why the sync broke. That's not maintenance. That's paying the Sync Tax.
Why the Maintenance Bill Never Sits on One Page
Why does the real maintenance cost stay invisible?
Building sits in project budgets, infrastructure in operations, incident response in another department, and coordination meetings under project-management overhead. Internal labor on incidents, cross-team meetings, glue code, spreadsheet workarounds, slower onboarding, and the revenue engineers did not earn because they were maintaining rarely land on any spreadsheet. In an interdependent system the cost also lives between modules, so nobody can assign it to one owner. A distributed monolith can consume 30% or more of engineering capacity on work that exists only because components are coupled.
What should leadership see before approving a feature?
Four costs on the same page. Building cost, which companies already track. Infrastructure cost, usually in another department. Maintenance cost, split into standard maintenance and the unaccounted work interdependence creates: coordination, sync maintenance, coupling incidents, and manual workarounds. Opportunity cost, the revenue not earned because engineers are in maintenance instead of building. The Sync Tax Multiplier does not predict the absolute maintenance number. It predicts the multiplier interdependence applies to whatever the baseline turns out to be.
Newsletter
Be the first to get next articles in this series.