The Engineering Tax · Article 10 of 29
Your Sprint Report Tells the Truth but Hides Everything That Matters
The CEO has your Sync Tax multiplier on the slide, nods, and asks when the next feature ships. Data alone gets a nod and a 'next' slide. The next article gives you the trade-off language to turn that metric into a shared decision, so the $40,000 Sync Tax on a feature becomes a visible fork both leaders negotiate together. A CTO who cannot say no costs more than any one bad feature ever could, and this framework gives them the language to say it.
From Status to State
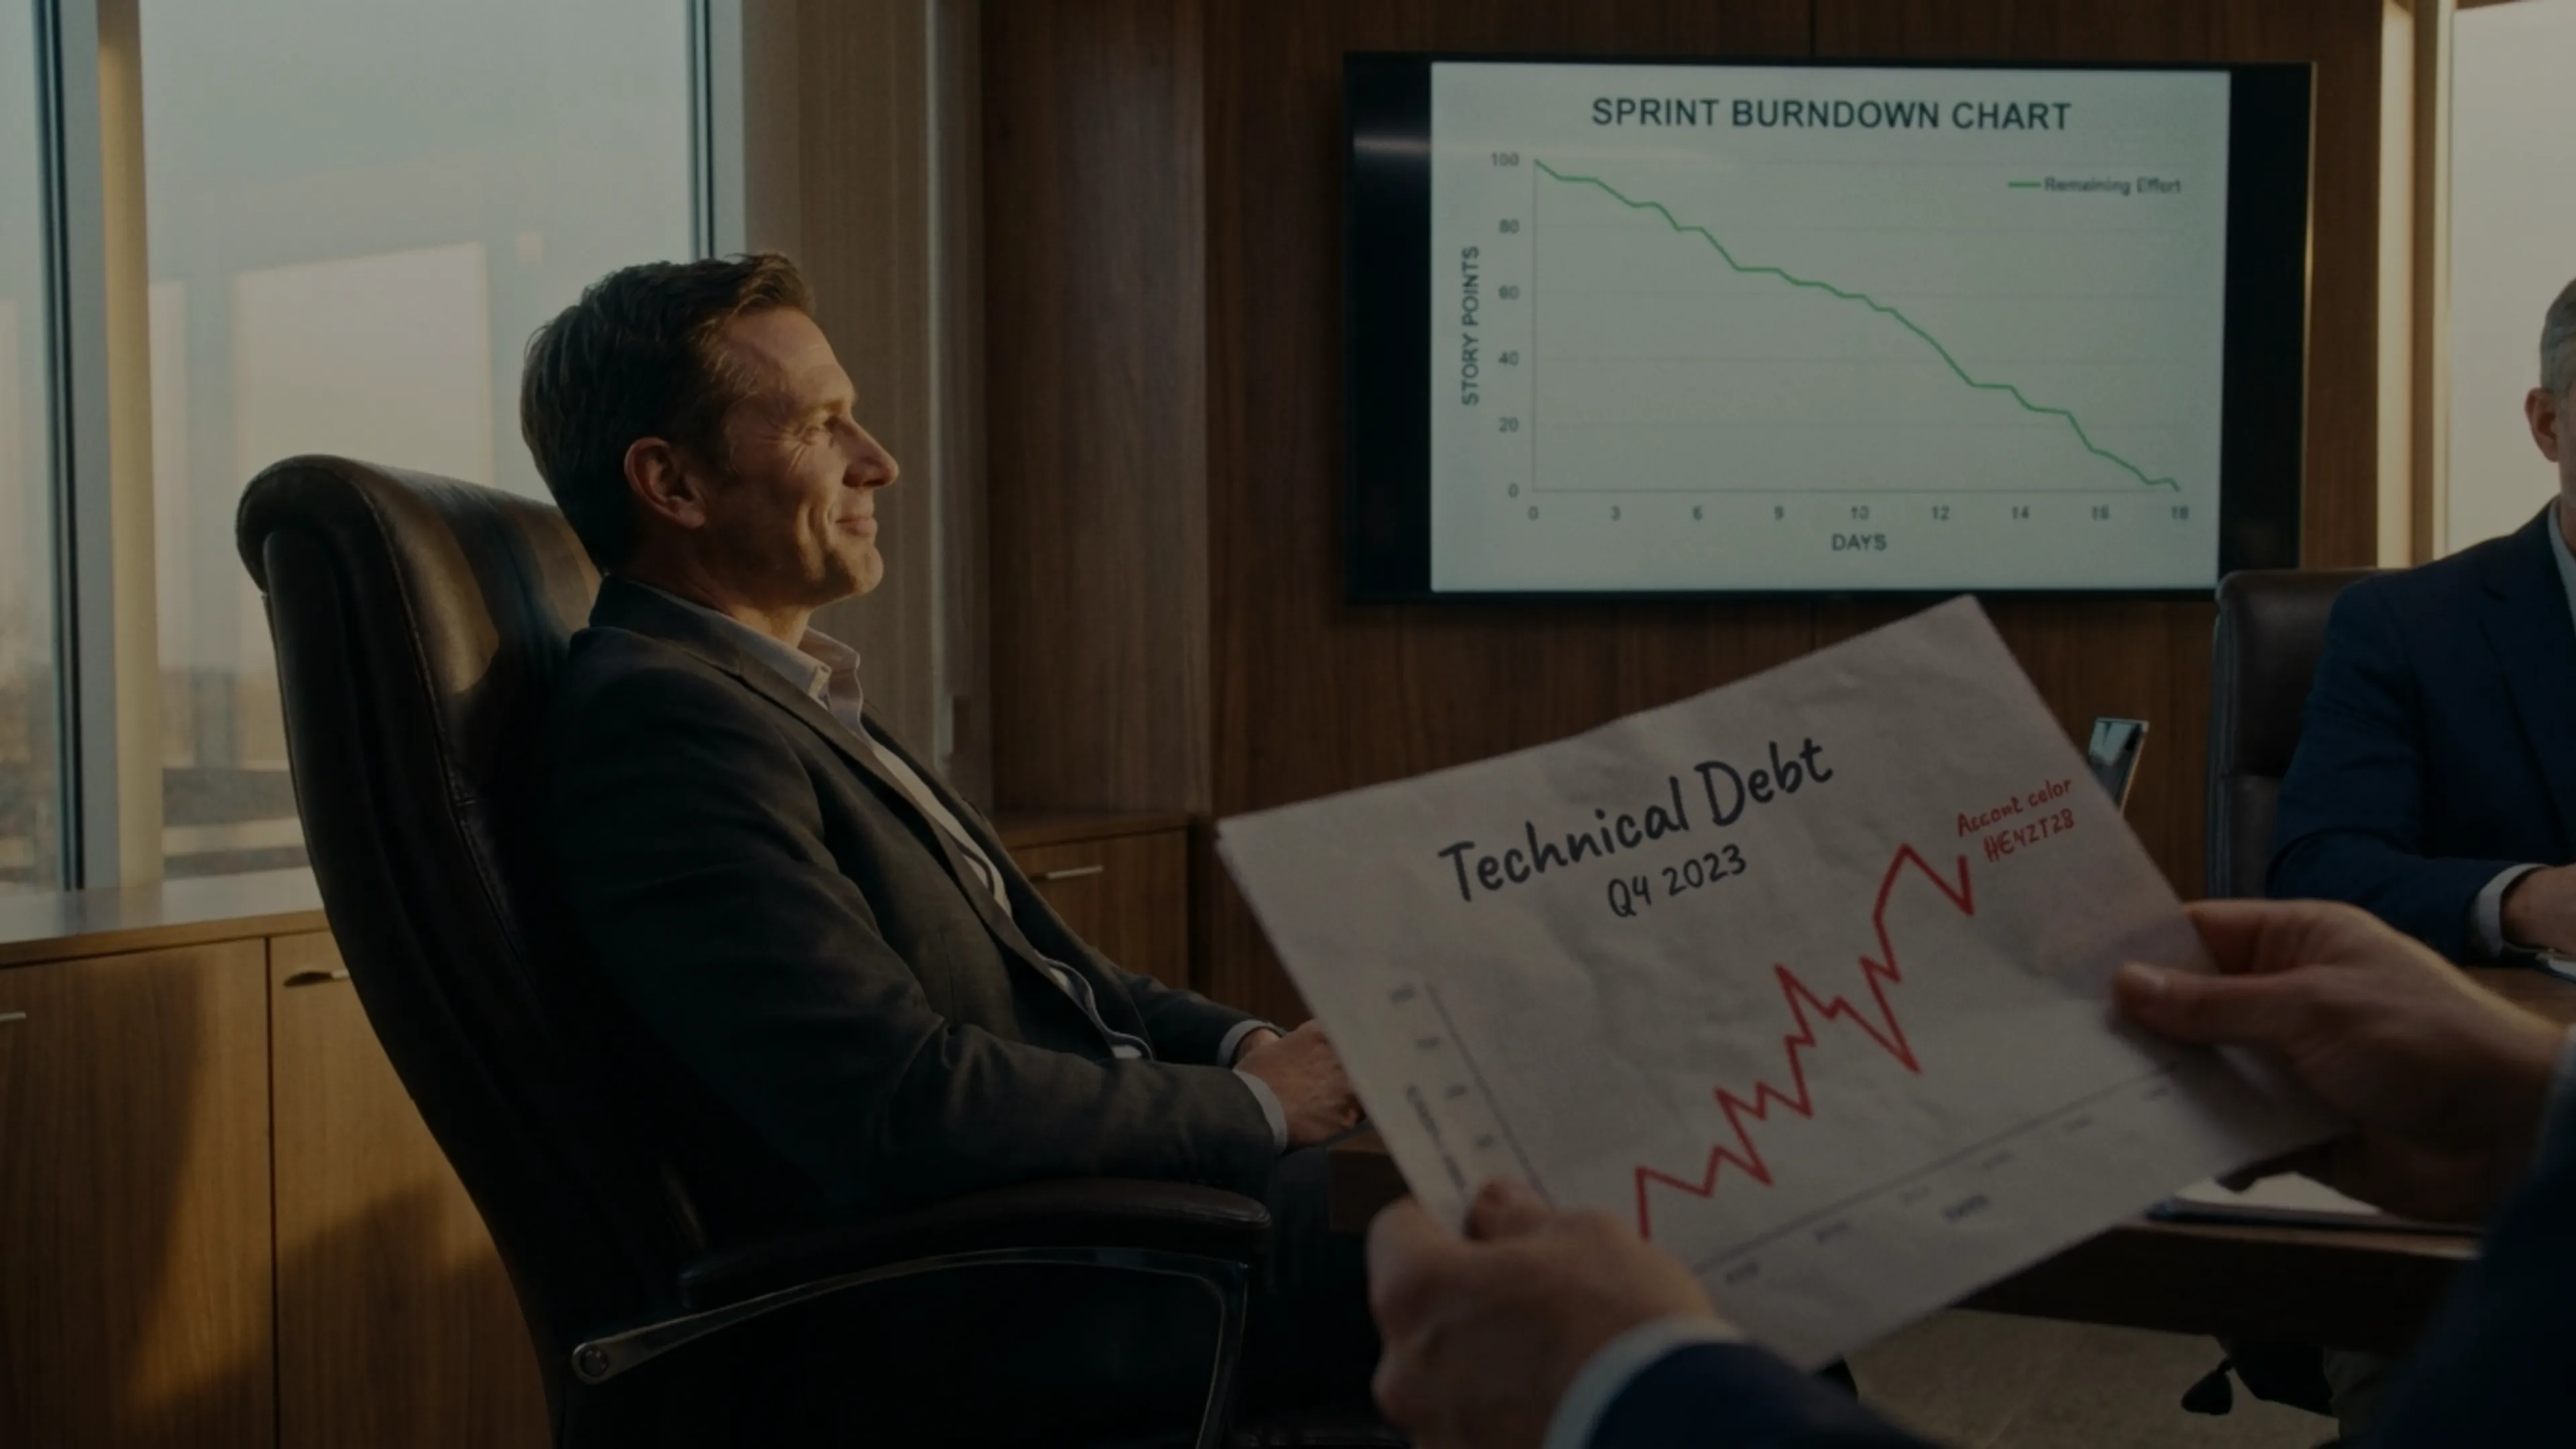
The CTO walks into the Monday executive meeting with a slide deck. The first slide shows the sprint is green. The CEO nods. The report tells the truth but hides everything that matters. A status report answers only one question: is the feature done, is the sprint on track, is today’s task finished. That is a transient signal. A state report answers a more consequential one: is the technical asset getting healthier or sicker over time, is our capacity to change increasing or decreasing. That signal is structural.
The VP of Engineering presents thirteen bullet points on what the team shipped. The CEO checks a box and moves on. The structural health of the codebase never comes up, because nobody asked for it. That gap is where companies lose control of their technical assets without ever noticing, because the report that would have shown the problem is the one that never gets requested.
The rest of this article covers what the CTO and the CEO have to do to close that gap. They must report state instead of just status, negotiate trade-offs on visible data, measure the structural metrics automatically so the data is honest, and prove the savings are real with an independent module example.
1. Status vs. State
- Status (Transient): Progress on specific tasks, such as “is the feature done.” It’s a surface-level metric that hides structural decay.
- State (Structural): The internal health and evolution of the technical asset, a trend, such as “is our capacity to change increasing or decreasing.”
Monitoring and reporting the State is the CTO’s job. Valuing the State over temporary Status is the CEO’s job.
A mirror just reflects what is in front of it, and an informant feeds scraps of truth to whoever happens to be asking. The CTO has to be neither of those. The CTO has to be transparent, which means having the courage to say when things are not OK, and pushing back before bad decisions get made. If the CTO does not have the courage to escalate a warning, the company is operating on bad information, and the CEO will not know until something breaks publicly.
The pattern is real. In one of my past jobs, the company hired and let go three CTOs in four years. None of them pushed back hard enough when the CEO kept pushing top-down priorities. The CEO was bragging that he could keep raising money to extend the runway, and he did. But every fundraising round extended an unprofitable run that had a fat monolith nobody dared to plan to kill. The top-down priorities were always in the way. The CTOs never said the obvious thing out loud, which was that the spend was not justified by the demand. The lesson is not that those CTOs were bad people. The lesson is that a CTO who cannot say “no” to a CEO is a tax on the company’s future, paid in silent waste.
2. Negotiating Trade-Offs
A healthy company runs on a value-driven partnership, not a hierarchy of imposition. Two ideas anchor this, and they come from outside software on purpose.
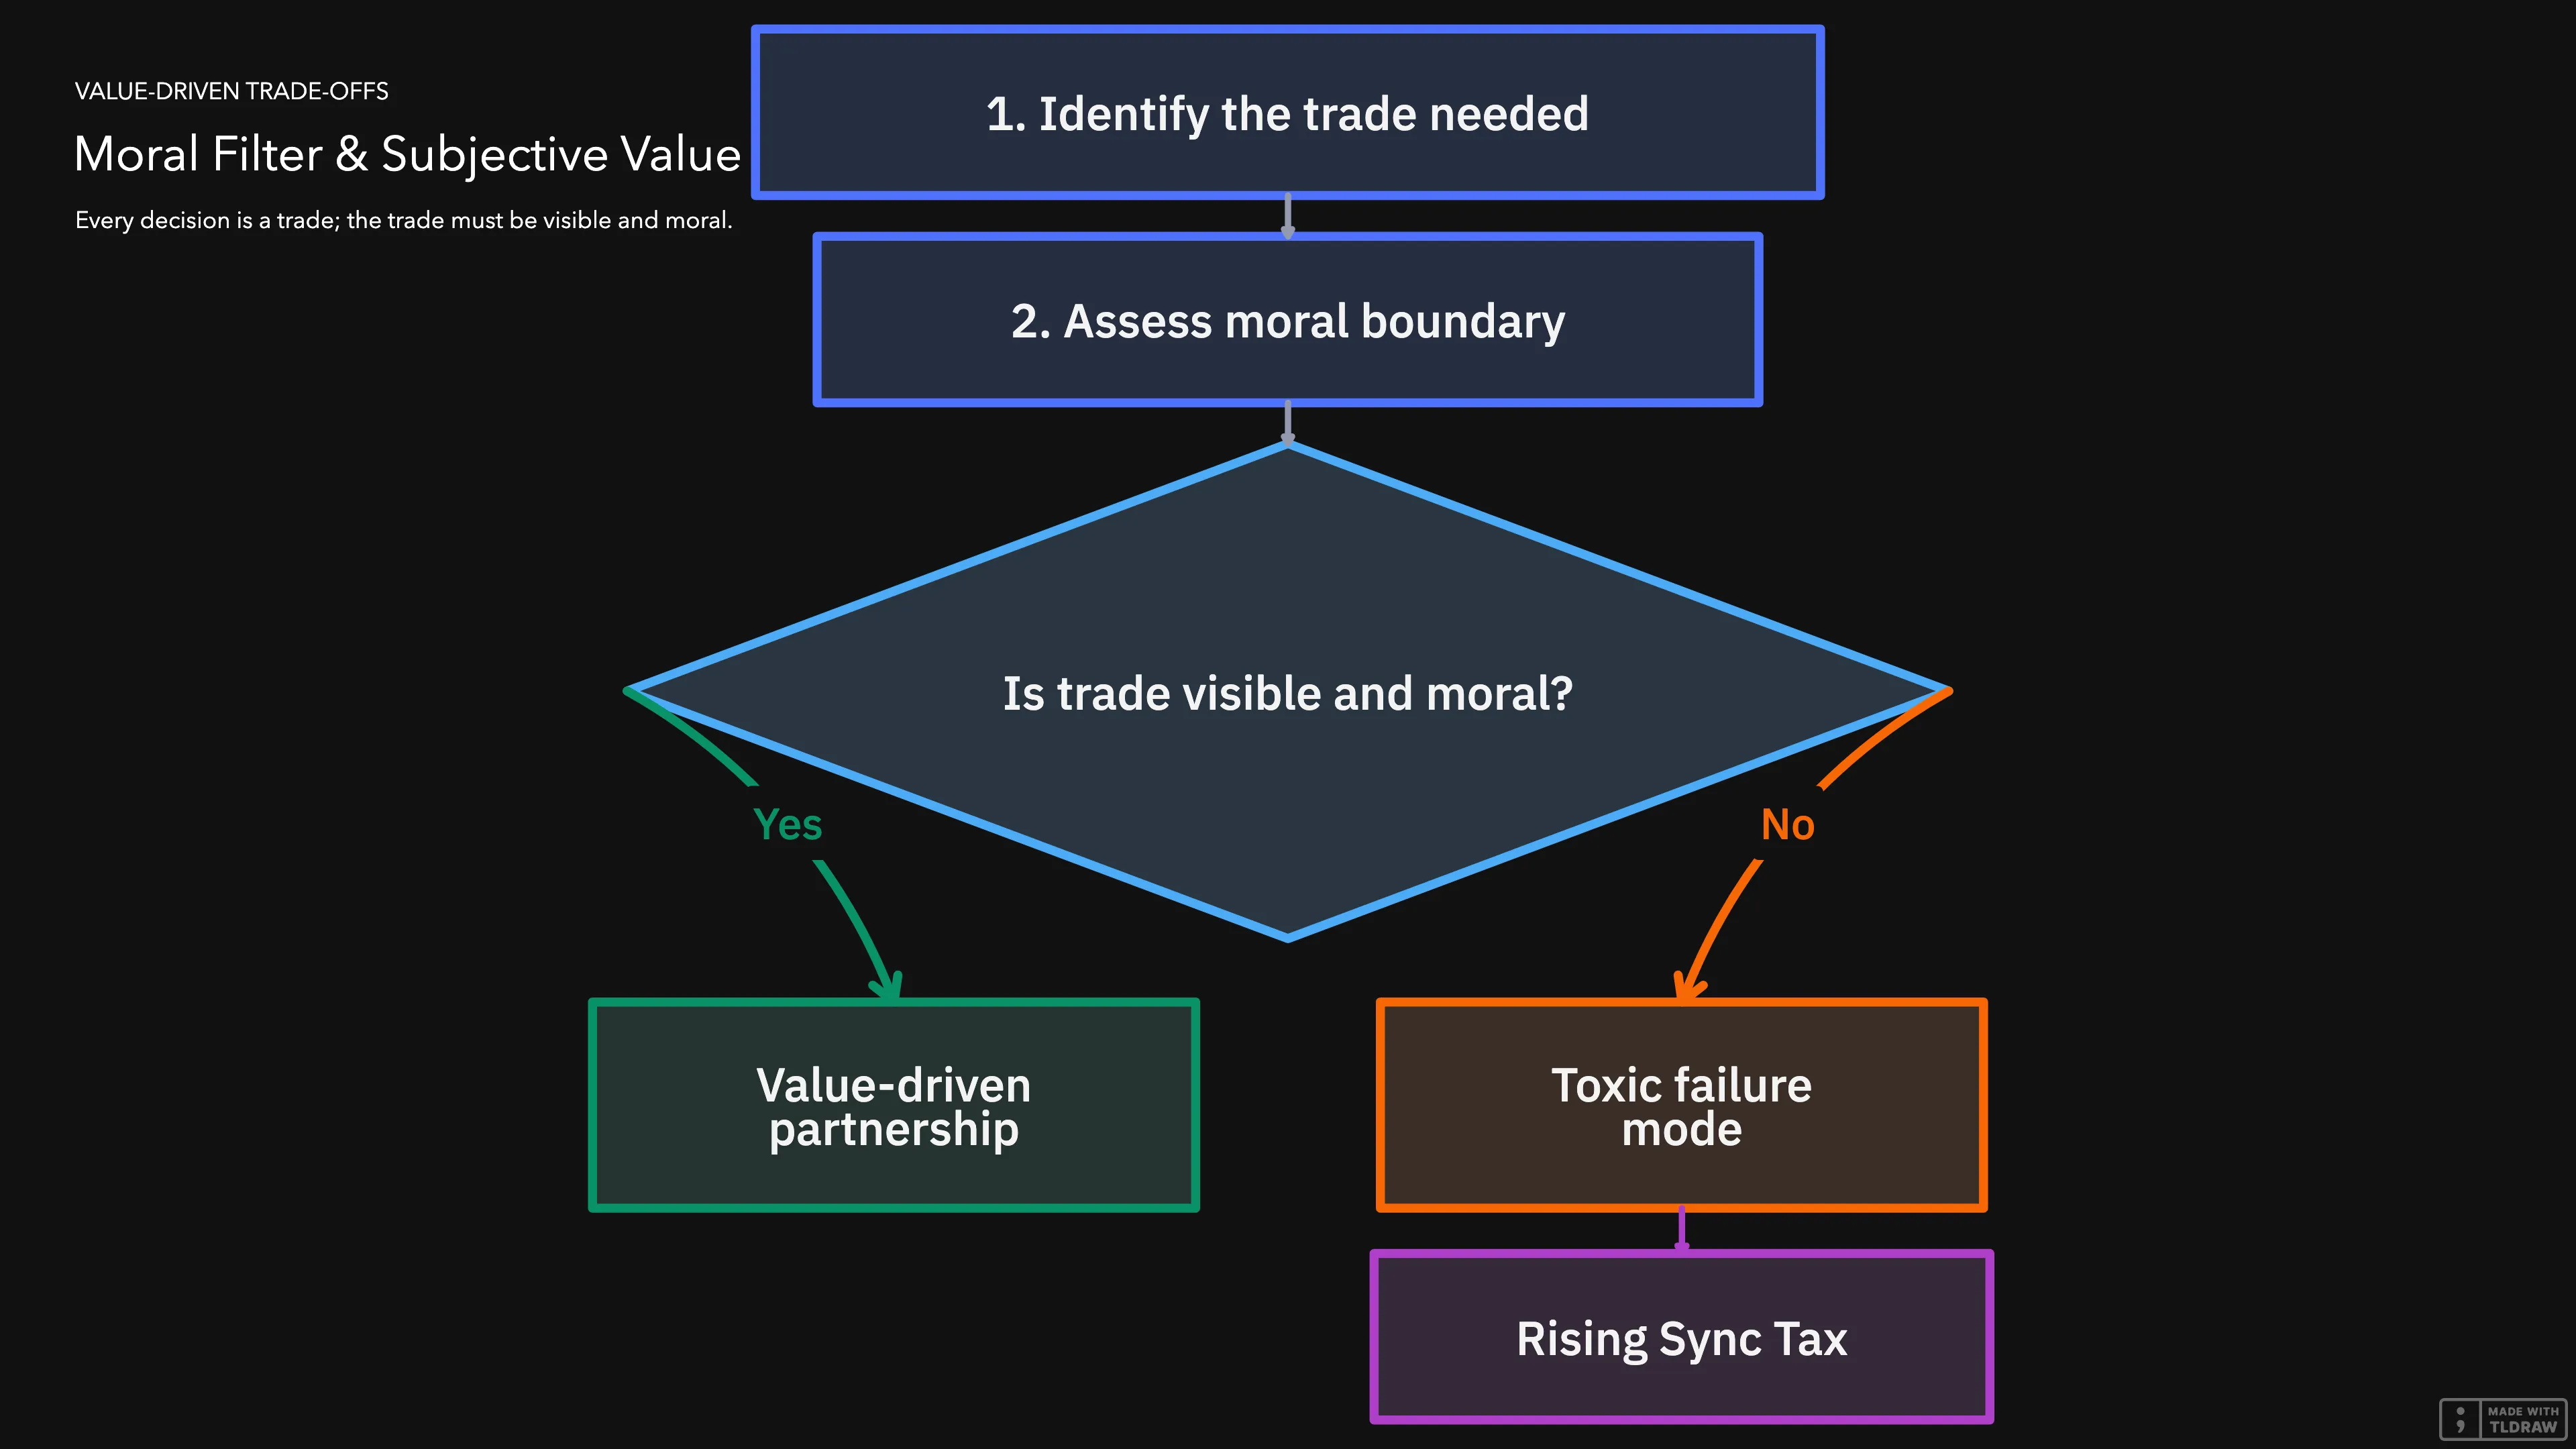
The first is the principle President Milei has used to describe his own governing philosophy: we will do anything to improve people’s lives, as long as those decisions are moral. So, not at any cost. The second is Mises’s insight that human action is always about what a person values most at a given moment. It always comes down to what I value more: X, or my money. Y, or Z. Both of these point to the same operating rule: every decision is a trade, and the trade has to be visible, which maps cleanly onto a CTO/CEO negotiation.
- Expert Ownership: The CEO hired experts to tell him what to do, not for him to tell them what to do. The CEO’s job is to listen to the technical boundaries the CTO raises and decide whether the trade is worth it. The CEO has to be a negotiator, not an overrider.
- Subjective Value: Decisions have to be made on what is valued most at the moment. If a feature costs 40,000 in Sync Tax, the CEO has to decide if that specific feature is worth the total price, not just the sticker.
- The Shared Language: Negotiating through the Sync Tax multiplier (the ratio of coordination cost to direct work) removes the “us versus them” toxicity. It replaces personal friction with objective data.
The failure mode goes both ways. The CEO who demands features at any cost creates a tech department that goes toxic, full of quiet resentment, and the work quality drops. The CTO who treats the rest of the company as the enemy, treating engineers as needing protection from “the business,” creates the same outcome from the other side: distrust, micromanagement, and silent sabotage on both ends, and both postures backfire.
When the Sync Tax rises, it is a shared failure to negotiate. The CTO failed to make the State visible. The CEO failed to value the future over the immediate Status. Neither side gets to blame the other; they both let the negotiation rot.
3. Automated Transparency
For the State to be trustworthy, it has to be measured automatically. Anything manual is gameable, and engineers will game it because incentives reward looking good, not being honest.
- Zero-Manual Reporting: All the underlying data has to flow from the code and the deployment pipeline itself, with no human in the loop filling in spreadsheets. The metrics include how tangled different parts of the code are, a measure called Connascence Degree. This is where the real financial cost and risk hides, because a high degree means any change in one place is likely to break several others. We also look at how many other parts of the system get touched when you change one part (Fan-Out), and how often a change breaks something that was working before (Regression Rate). These are the structural indicators. Manual reporting of them is theater.
- One-Off Tooling: Setting up this infrastructure is a one-time technical investment. Once the data pipeline is wired into the system, it stays. It becomes a permanent part of the technical asset’s monitoring. There is no per-quarter rebuild.
- Supply and Demand of Truth: The CTO owns the supply of the data. The CEO owns the demand. If the CEO stops demanding the truth because he wants to “accelerate” at any cost, he is choosing to operate without information. The cost of that choice shows up later, and it is always larger than the cost of knowing now. The demand has to exist or the supply atrophies.
The tooling itself has to be transparent about what it measures and how, so engineers can trust it. Engineers will reject any system that feels like surveillance. A system that just measures the code automatically, with no manual reports and no subjective judgement, is hard to argue with, because the data is the data.
4. Independent Modules in Practice
The savings show up the moment a piece of the product is built as an independent module with a clean interface, meaning no dependencies on the rest of the system. Take a Payment module.
- Interchangeability: The Payment module can be rewritten in a faster language (for example, moving from TypeScript to Rust) without touching the rest of the product. Zero coupling means the rewrite is contained. It could even be outsourced, as long as the interface remains untouched, the rest of the system shouldn’t even notice the difference.
- Zero Structural Coupling: New integrations (regional payment methods like Blik in Poland) or changes elsewhere in the product have a guaranteed zero impact on the Payment module. None of those changes affect it.
- Resource Reallocation: The hours saved by removing structural friction are immediately available for work that addresses actual customer demand. That time is returned back to the company’s pocket and now can be invested in something with actual demand.
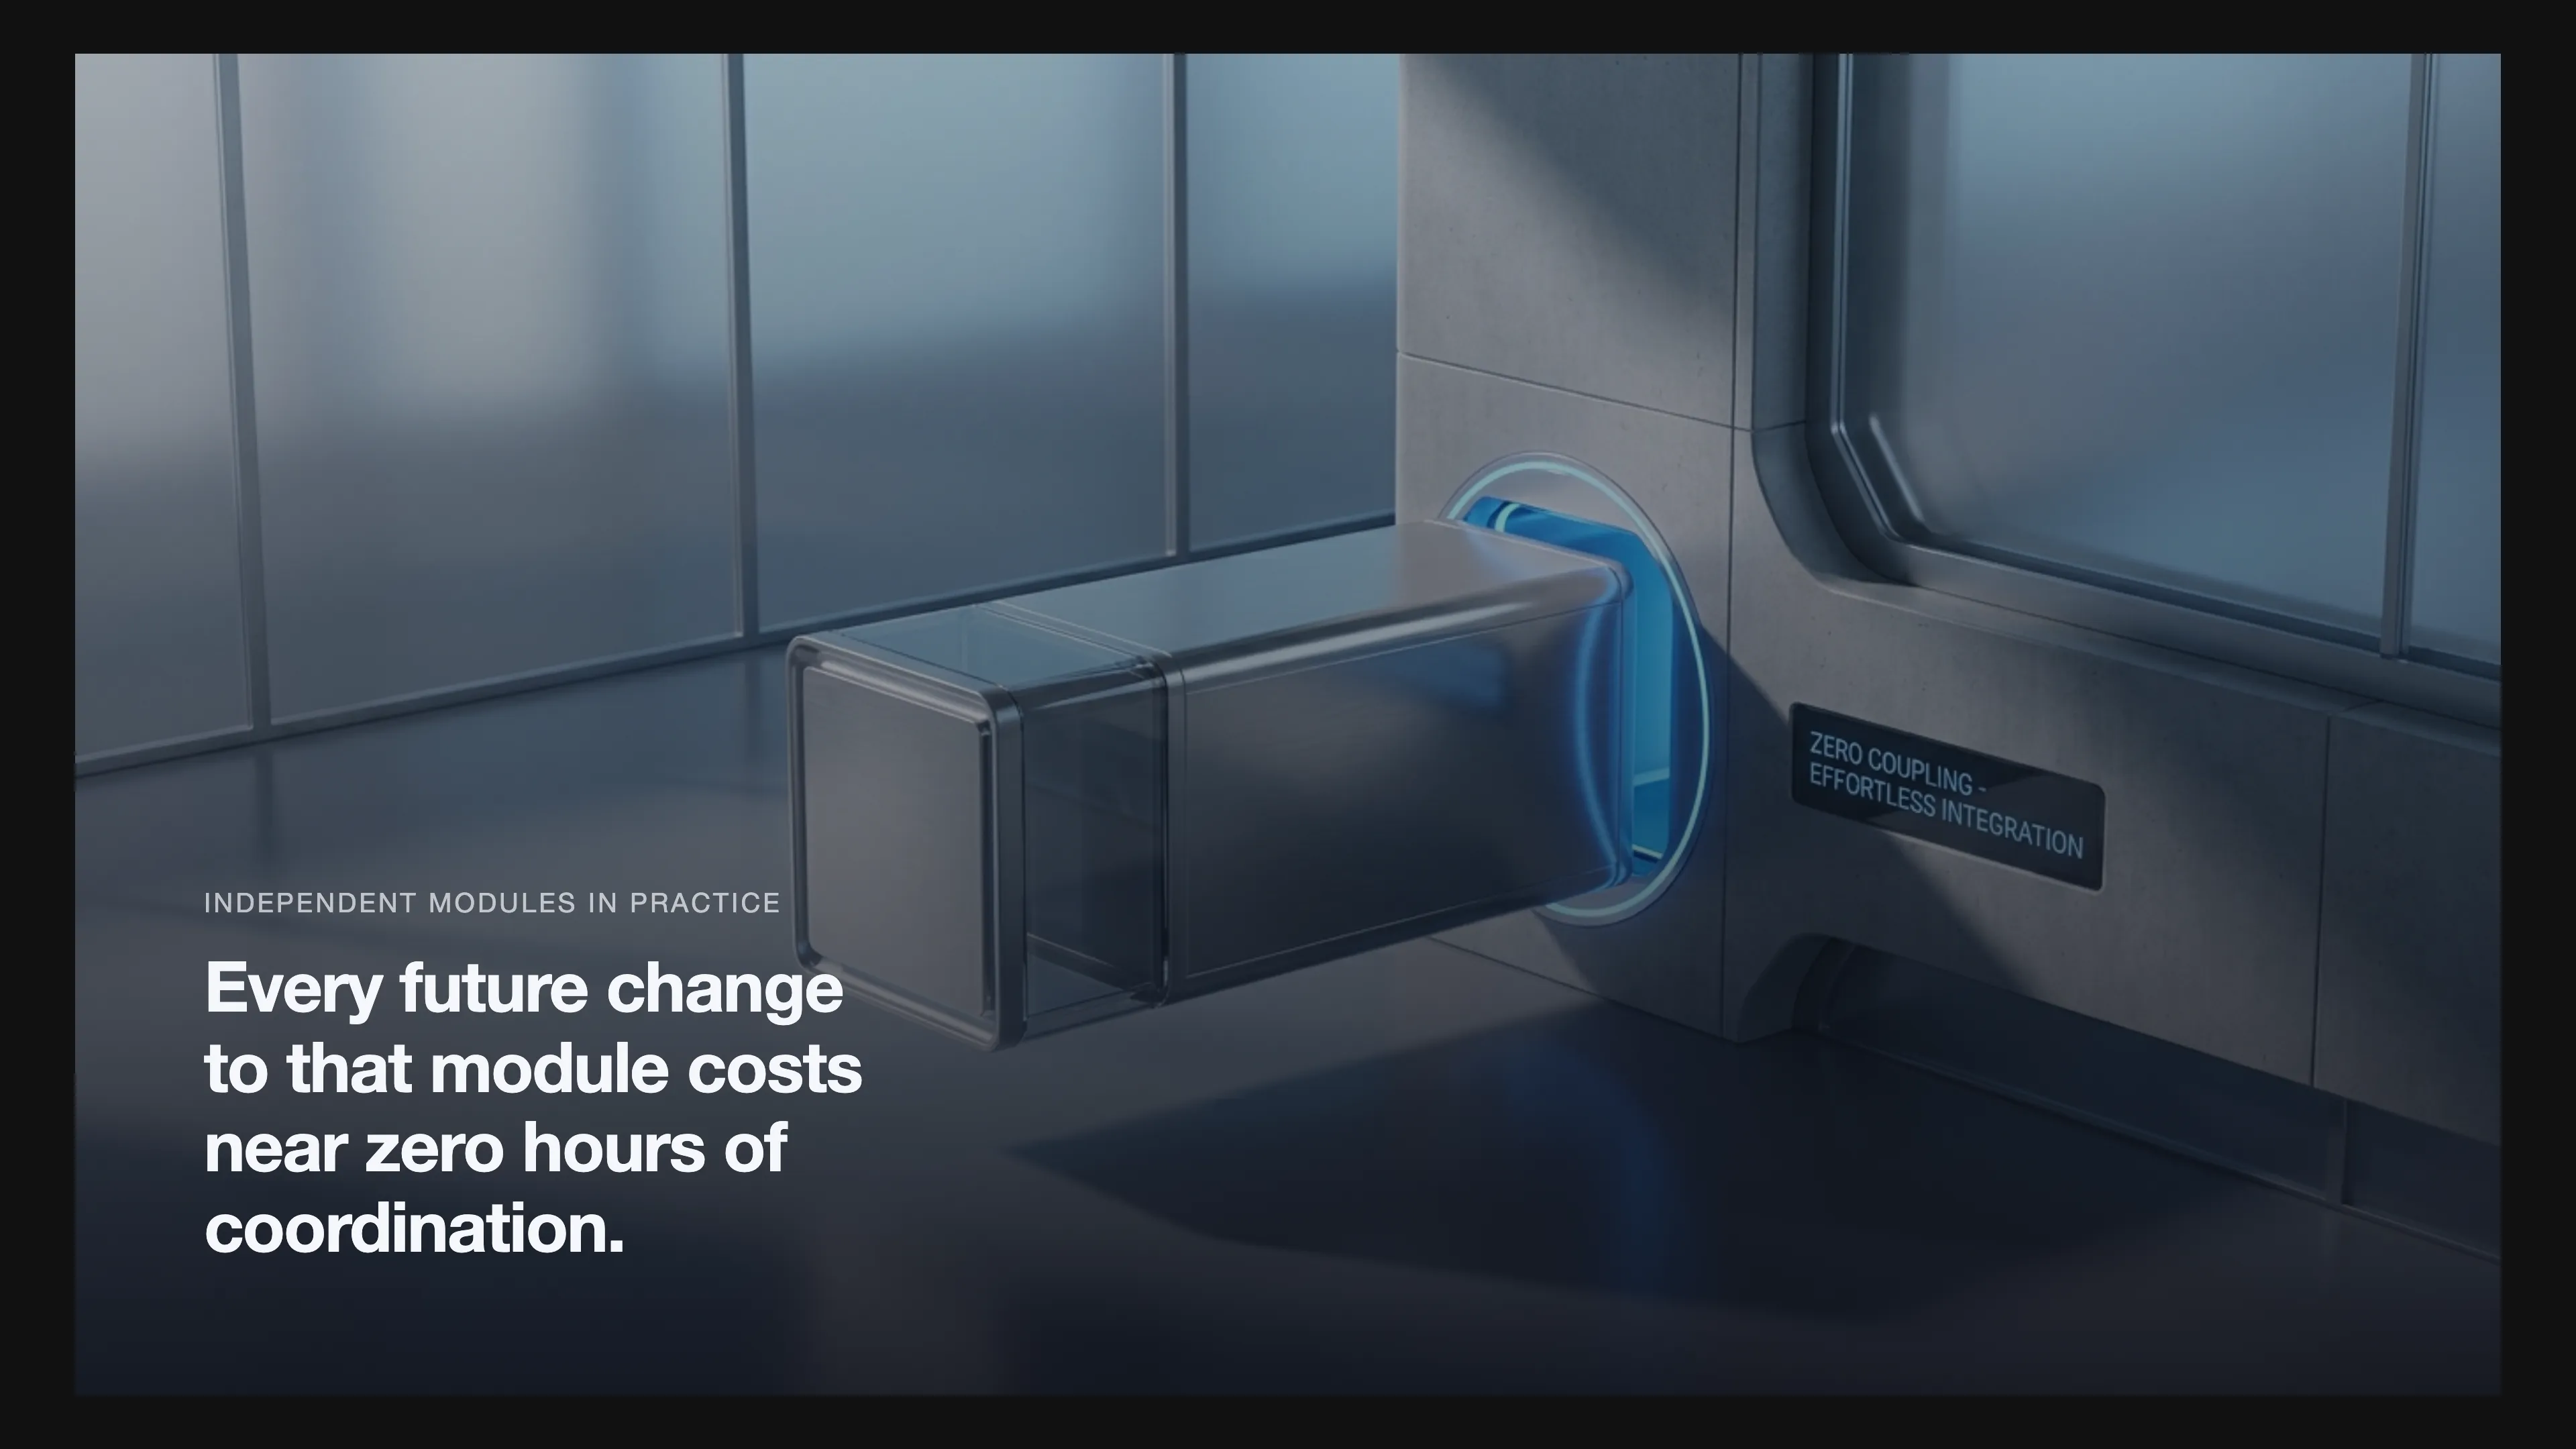
The savings compound. Every future change to that module, every new payment provider, every currency switch, every regional expansion, costs near zero hours of coordination. The module is independent and the rest of the system does not depend on its internal details. That is the State of a healthy technical asset: change gets cheaper over time instead of climbing.
References
- Milei, J. (2026). Special Address at the World Economic Forum Annual Meeting 2026. Davos. Retrieved from weforum.org
- Mises, L. von. (1949). Human Action: A Treatise on Economics. Chapter I, Section 2: “The Prerequisites of Human Action”. Retrieved from mises.org
- Page-Jones, M. (1992). “Comparing Techniques by Means of Encapsulation and Connascence”. Communications of the ACM, 35(9). See also: Connascence on Wikipedia.
- Henry, S. & Kafura, D. (1981). “Software Structure Metrics Based on Information Flow”. IEEE Transactions on Software Engineering. See also: Fan-out (software) on Wikipedia.
- DORA (DevOps Research and Assessment). DORA Metrics: Change Failure Rate. Retrieved from dora.dev
← Previous: The Setup That Turns a 20-Hour Feature Into an 80-Hour One
Up next in The Engineering Tax · Article 11
The Cost of Not Understanding the Technology You're Building On
You signed off on a delivery date your team knew was too short. That loan against future capacity compounds invisibly in every sprint after. The next article in The Engineering Tax series goes inside the gap between what a CEO sees and what the software is becoming, and why the CEO's relationship to technology is the most expensive variable in the company's structural cost. The leaders who learn to read the real signals before they commit will operate on a different level of information, and that advantage is theirs the moment they start looking.
Frequently asked questions
How to Prioritize Technical Work
How to Prioritize Technical Work
Every feature proposal must answer three questions. Are we adding this because customers demand it or because competitors have it? Does this feature differentiate us or commoditize us? What's the real economic cost including three years of maintenance? Apply the economic filter to everything costing more than a day of work. If five people work one day each, that's five days the company pays. Track the Sync Tax cost of each decision.
What else should leaders know about How to Prioritize Technical Work?
A feature that costs $10K in direct work but $40K in Sync Tax may not be worth building. The CEO owns this process. He sets the thresholds and approves the validation. If he can't justify a feature economically, it doesn't get built.
How CTOs and CEOs Should Negotiate Technical Trade-Offs
Why does a sprint report hide what matters?
A status report answers whether the feature is done and the sprint is on track. That is a transient signal. A state report answers whether the technical asset is getting healthier or sicker, and whether the company's capacity to change is increasing or decreasing. The CTO who only reports status leaves the CEO operating on incomplete information.
How should a CEO and CTO negotiate a feature that carries Sync Tax?
The CEO hired experts to say what the technical boundaries are, not to be overridden. Put the full price on the table: if a feature costs $10,000 in direct work and $40,000 in Sync Tax, the CEO decides whether that feature is worth $50,000, not $10,000. The Sync Tax multiplier is the shared language. A CTO who cannot say no is a tax on the company's future.
State vs Status: What Engineering Leaders Should Report
What is the difference between State and Status?
Status measures progress on specific tasks. Is the feature done? Are we on schedule? It's transient and surface-level. State measures the internal health of the technical asset. Is our capacity to change increasing or decreasing? Is the system getting healthier or rotting? The CTO monitors State. The CEO must value State over temporary Status.
How do you make technical metrics transparent?
All metrics must flow automatically from the code and deployment pipeline. Zero manual reporting. Connascence degree, fan-out, and regression rates should be visible to anyone who looks. Once the data is visible, hiding problems becomes impossible.
Newsletter
Be the first to get next articles in this series.